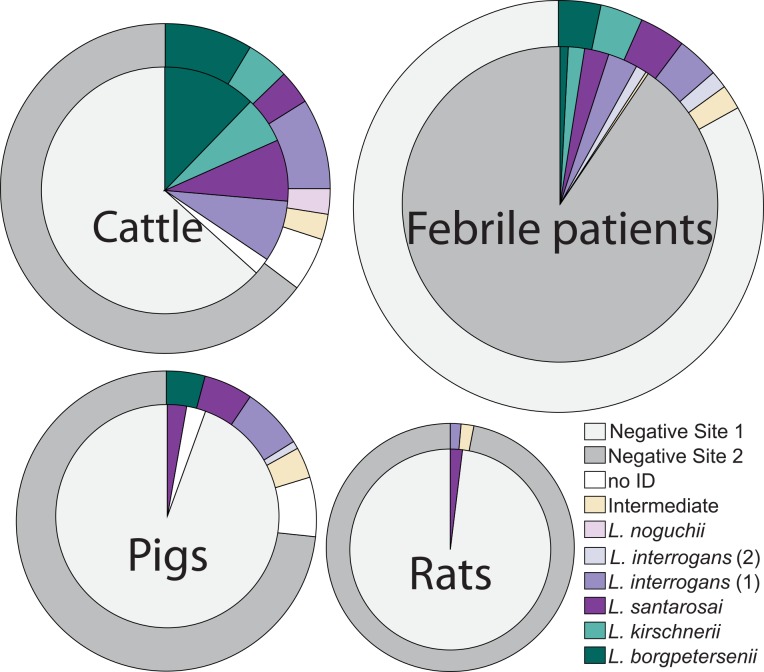
Fig 1. Leptospira genotyping results in febrile patients, cattle, pigs and rats sampled at our study sites.
Concentric circles represent the sample size in Site 1 (colored with light gray) and Site 2 (dark gray). The order of these concentric circles is dependent on the sample size at each site. The proportion of each Leptospira genotype is marked with a different color, however white portions represent the percentage of samples for which genotyping was unsuccessful. Sample sizes for each group is detailed in Table 2 and S6 Table.

