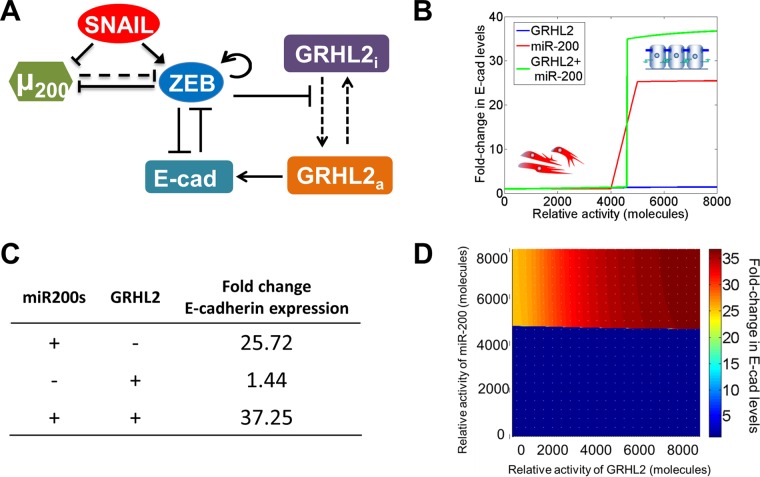
FIG 4.
A proposed regulatory network of E-cadherin control. (A) ZEB1 represses GRHL2-induced activation of E-cadherin. Dashed lines indicate the transition of GRHL2 from inactive to active and miR-200 translational repression of ZEB1; solid arrows and bars show transcriptional activation and repression, respectively, of a given gene. (B) According to the proposed model, activation of GRHL2 results in almost no change in E-cadherin. Conversely, miR-200 upregulation induces E-cadherin expression, while the combined expression of miR-200s and GRHL2 has a synergistic effect on E-cadherin. (C) Relative levels of E-cadherin upon combined miR-200 and GRHL2 upregulation are synergistic. (D) Heat map of the miR-200- and GRHL2-induced E-cadherin expression model predicts that at a threshold of miR-200 expression, E-cadherin is upregulated. This effect is enhanced by GRHL2 expression (upper right, in dark red).

