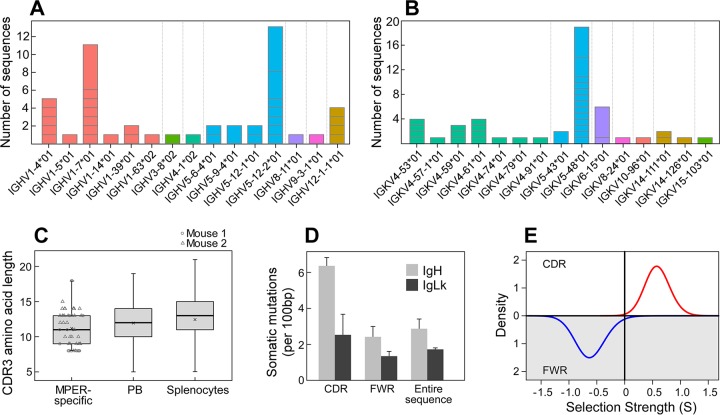
FIG 3.
Immunoglobulin gene usage within the MPER-specific bone marrow plasma cell population is diverse. Immunoglobulin genes from two mice (n = 66 total sequences generated; 48 sequences were analyzed) were amplified from single MPER-specific IgG-secreting plasma cells. The usage frequencies of immunoglobulin VH genes (IGHV) (A) and VL genes (IGKV) (B) are diverse. V gene families were defined using IMGT and color coded by gene family. The number of sequences representing each IGHV and IGKV family is shown, with horizontal gray lines separating groups of clonally related sequences within each V gene cohort. (C) Box plot of CDRH3 length distributions. CDRH3 regions were identified by IMGT, and amino acid lengths were calculated. Each point represents a sequence from mouse 1 (circles) or mouse 2 (triangles). For comparison, mouse CDRH3 lengths for IgG sequences from splenocytes or plasmablasts (PB) are shown, using previously published data (76). Note that a single outlier point for mouse splenocytes is not shown. The mean value for each group is marked with a cross. (D) The number of somatic mutations per 100 germ line-defined base pairs was calculated for the CDRs, the FWRs, and the entire sequence of the IgH (gray columns) and IgLk (black columns) V genes. (E) BASELINe analysis of selection pressure on IgH V gene sequences. Significant positive selection was calculated for nonsynonymous CDR mutations (Σ = 0.59; P = 0.005; red line), along with significant negative selection against nonsynonymous mutations in the FWR region (Σ = −0.62; P = 0.015; blue line). The data represent analyses of sequences from two independent B cell/immunoglobulin gene isolations by microengraving.

