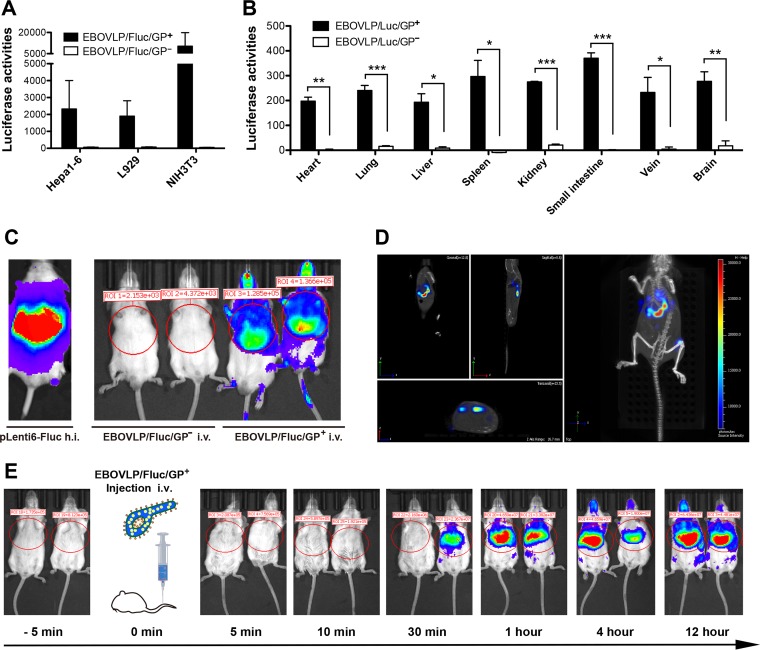
FIG 5.
EBOVLP/Fluc/GP+ inoculation produces bioluminescence in mice. (A) EBOVLP/Fluc/GP+ delivery in different mouse cell lines, including Hepa1-6, L929, and NIH 3T3. (B) Ex vivo tropism of EBOVLP/Fluc/GP+. Mouse cells isolated from main organs (heart, lung, liver, spleen, kidney, small intestine, vena cava, and brain) of BALB/c mice were inoculated with EBOVLP/Fluc/GP+ and subsequently analyzed for intracellular luciferase activity. Mean values plus SEM are shown. The asterisks represent significant differences: *, P < 0.05; **, P < 0.01; ***, P < 0.001. (C) EBOVLP/Fluc/GP+ challenge of BALB/c mice. Six-week-old BALB/c mice were challenged by intravenous (i.v.) injection with VP40-normalized (2 μg) EBOVLP/Fluc/GP+ or EBOVLP/Fluc/GP−. PBS was given as a negative control, while hydrodynamic injection (h.i.) of the pLenti6-Fluc plasmid (100 μg/mouse) was set as a positive control. In vivo imaging was performed 12 h postinoculation. (D) Representative 3D bioluminescence from EBOVLP/Fluc/GP+-inoculated mice. 3D imaging was performed at 12 h postinoculation using the IVIS SpectrumCT system. (E) Dynamics of bioluminescence in EBOVLP/Fluc/GP+-inoculated mice. The inoculated mice were subjected to live imaging at the indicated time points. The images were adjusted and are shown at the same scale.

