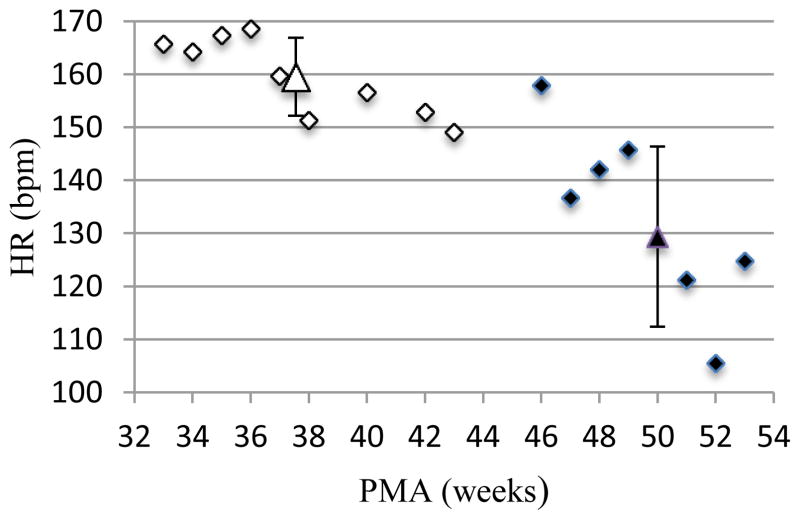
Figure 1.
Infants were divided in groups by week of their post-menstrual age (PMA) at the time of the study. Then mean HR for each group was plotted against the PMA. In this figure data are plotted for infants in the first study (in white) and for those who returned for the follow up (in black). Mean and SD for each of these two groups are depicted by the large white and black triangles.

