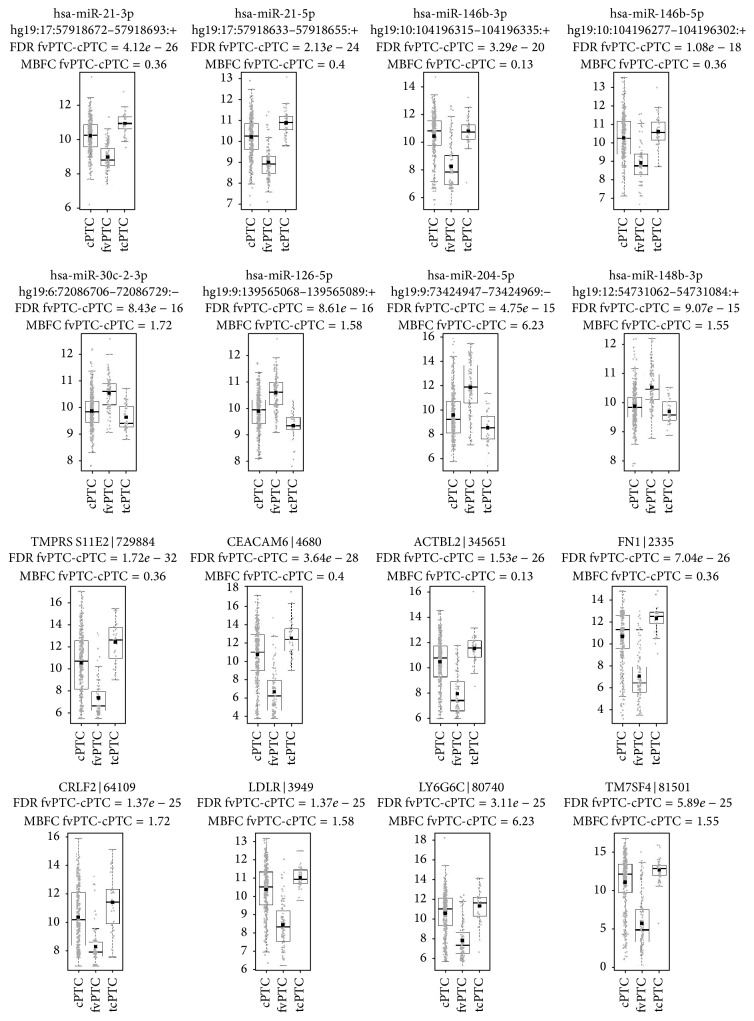
Figure 2.
miRNAs and genes with the most differentially changed expression in classic PTC versus follicular variant PTC. Distributions of cPTC and fvPTC expression data overlap significantly; on the other hand, fvPTC and tcPTC distributions are relatively diverse. Top 8 miRNAs and genes were selected according to rules presented in Section 2, Statistical Testing and Annotation. miRNA data were annotated with hsa-miR number and hg19 isoform loci, whereas gene expression data were annotated with gene symbol and Gene ID.

