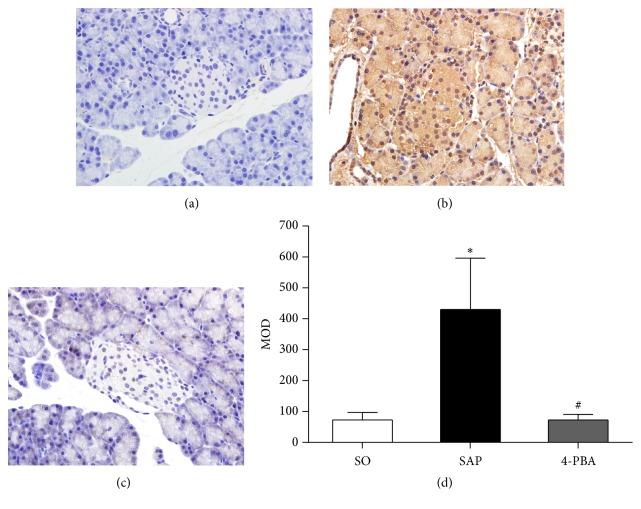
Figure 8.
Immunohistochemical expression of CHOP in pancreatic islets (original magnification, ×400). (a) SO group; (b) SAP group; (c) 4-PBA group. (d) Comparison of MOD of CHOP in all groups. Each value represents the mean ± standard deviation. ∗ P < 0.05 versus SO group; # P < 0.05 versus SAP group.

