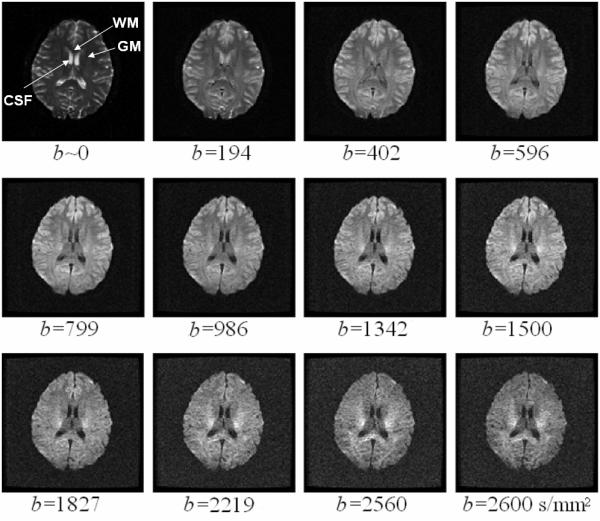
Figure 2.

A set of 12 representative DW images acquired from a human volunteer using the TRSE pulse sequence with b-values ranging from 0 to 2,600 s/mm2. The b-value is labeled underneath each image. The arrows in the first image indicate the ROIs in WM (genu of the corpus callosum), GM (putamen) and CSF (lateral cerebral ventricle) that were used in the analyses presented in Fig. 3 and Tables 1 and 2.
