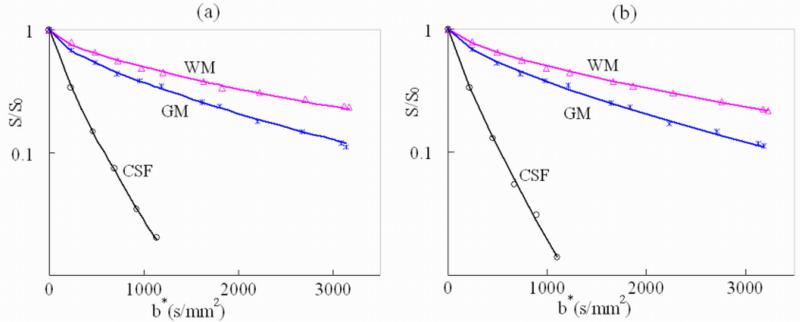
Figure 3.
Signal attenuation and the fitting curves as a function of b* for the three specific ROIs in white matter (WM), gray matter (GM), and the cerebrospinal fluid (CSF) indicated in Fig. 2. (a) Results from the Stejskal-Tanner pulse sequence where b* is defined as b* = (γGdδ)2[Δ – (2β −1)δ/(2β +1)], and (b) results from the TRSE sequence in which b* is given by . In CSF, only images with b < 1,000 s/mm2 were used in the fitting due to inadequate SNR in images with higher b-values.

