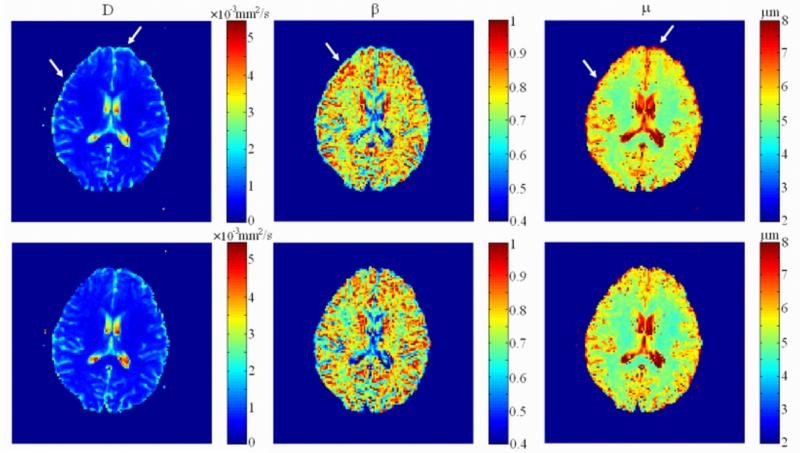
Figure 4.
Comparison of the parameter maps (D, β, and μ) obtained from the images acquired with the Stejskal-Tanner (upper row) and the TRSE pulse sequences (lower row). The arrows indicate the location of the edge artifacts due to residual eddy currents in the maps obtained using the Stejskal-Tanner gradient. These artifacts are noticeably reduced in the maps obtained with the TRSE pulse sequence.

