. 2016 Aug 22;5:e17256. doi: 10.7554/eLife.17256

Figure 5. Selectivity and stimulus-induced suppression interact to control attention modulation.

(A, B) Average attention modulation as a function of stimulus-induced suppression (x-axis) and stimulus selectivity (y-axis) in the cRF-cRF and sRF-cRF configuration respectively. The magnitude of attention modulation is indicated by color (red = strong, blue = weak). Note that, although the data covered most of this space (see Figure 4G,H), few regions, e.g. the lower right corner in (B), were not well sampled. (C) Model schematic. Every stimulus contributes an excitatory drive (L1 and L2) to the neuron's response (R1,2att) to a Gabor pair. Each stimulated receptive-field location, either inside the cRF or inside the surround, contributes divisive suppression (α1 and α2) to the neuron's response. The divisive suppression is fixed for each receptive-field location, independent of the stimulus presented at that location. A small amount of baseline suppression is further added (σ parameter; not shown). Directing attention toward a stimulus location has a multiplicative effect (β) on the parameters (L2 and α2) corresponding to the attended receptive-field location (location 2 in the schematic). (D, E) Average model-predicted attention modulation as a function of the observed stimulus-induced suppression (x-axis) and the observed stimulus selectivity (y-axis) in the cRF-cRF and sRF-cRF configuration respectively (See also Figure 5—figure supplement 1). Same conventions as in (A, B).

DOI: http://dx.doi.org/10.7554/eLife.17256.009

Figure 5.

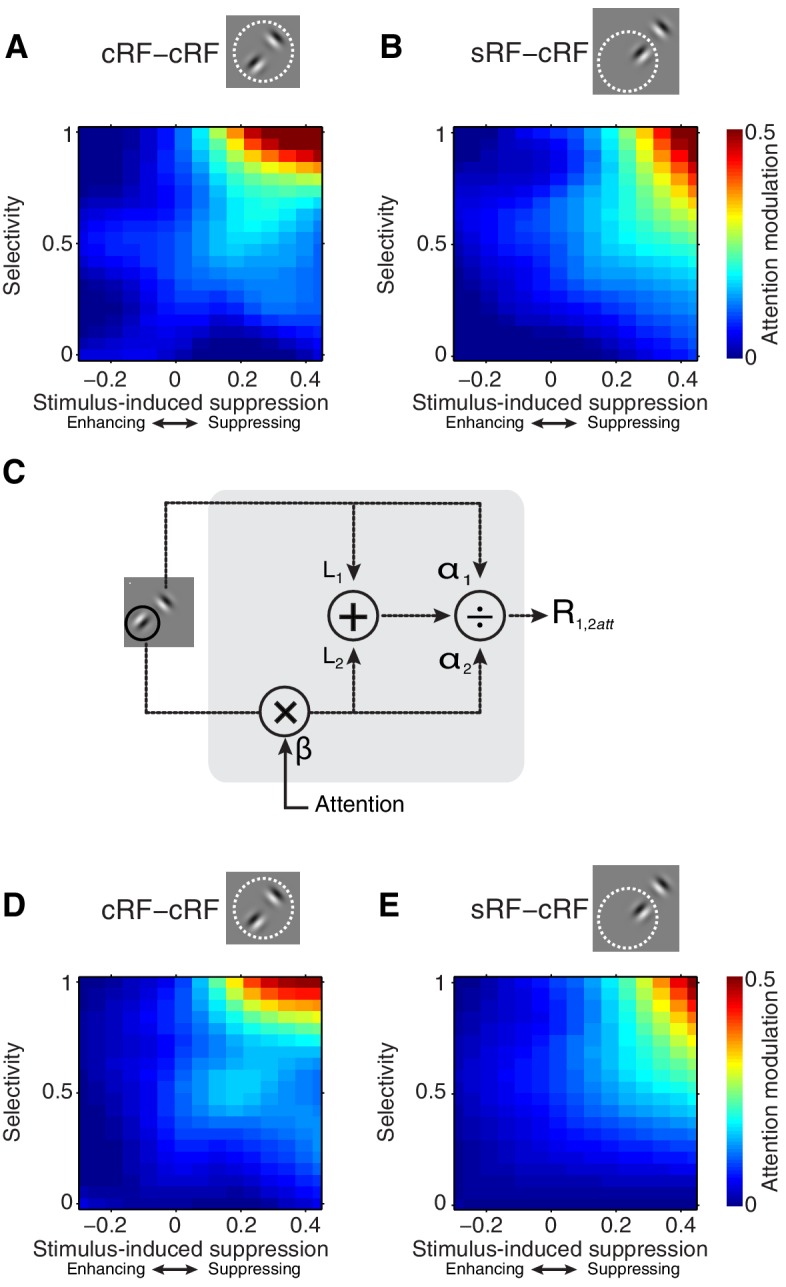
Figure 5—figure supplement 1. Example single-neuron responses and their corresponding model fits.

Figure 5—figure supplement 1.

(A) Neuron with a preferred (P) and non-preferred (N) stimulus presented inside the cRF (cRF-cRF condition). Black: observed responses. Grey: modeled responses. P, Patt, N, Natt show the responses to the individually-presented preferred and non-preferred stimulus with attention away (P, N), or attention directed to the stimulus (Patt, Natt). PN shows the condition in which both stimuli were presented simultaneously with attention away (PN), attention directed toward the preferred stimulus (PattN), or directed toward the non-preferred stimulus (PNatt). The values of the model parameters for each example neuron are shown on the right. Note that these parameter values correspond to spike counts in a 250 ms window and should be multiplied by four to obtain spikes/s. This neuron's response is suppressed when a non-preferred stimulus is added to a preferred stimulus (P vs. PN). The model accounts for this difference because the non-preferred stimulus induces few excitation (small L2) but large enough suppression (α2). So suppression dominates over excitation. The model also captures the strong attention modulation (PattN vs. PNatt) through the β parameter, which multiplies the excitatory drive (L) and suppressive drive (α) of the attended stimulus. By increasing the weight of both drives, attention effectively focuses on the inputs related to the attended stimuli, as if the inputs from other stimuli were attenuated. So attention to a weak stimulus decreases the response, while attention to a strong stimulus increases the response (i.e. attention modulation). (B) Neuron with a cRF (P) and surround (N) stimulus (sRF-cRF condition). The model accounts for the observed suppression and attention modulation, which is similar to that of the neuron in A (cRF-cRF condition). (C) Neuron with a cRF (P) and surround (N) stimulus (sRF-cRF condition). The surround stimulus induces no surround suppression (low α2 and L2value). As a result, shifting attention between the cRF and the surround stimulus leads to virtually no attention modulation.