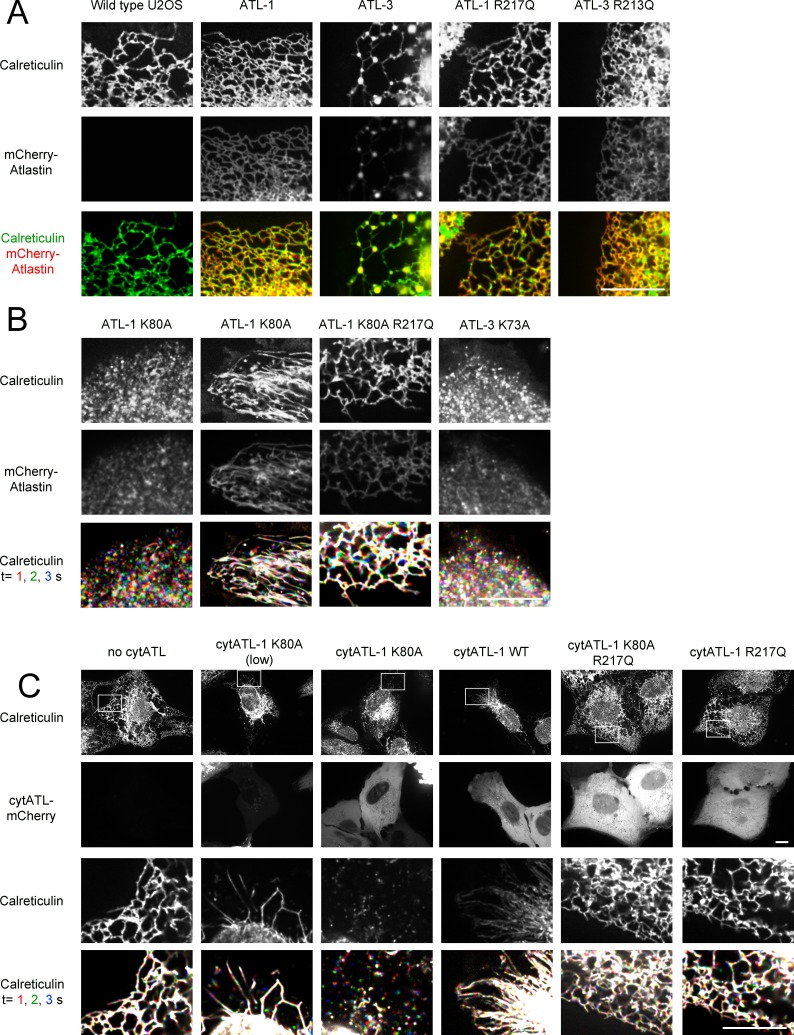
Figure 1. ATL is required to maintain tubules and junctions in mammalian cells.
(A) Peripheral ER network of U2OS cells expressing GFP-calreticulin from the endogenous promoter in wild type cells. Where indicated, the cells also stably expressed mCherry-tagged wild type ATL-1 or ATL-3 or the corresponding dimerization-defective mutants (ATL-1 R217Q or ATL-3 R213Q). Scale bar = 10 µm. (B) As in (A), but with cells stably expressing mCherry-tagged ATL-1 or ATL-3 mutants defective in GTP hydrolysis (ATL-1 K80A or ATL-3 K73A). The first and second columns show ATL-1 K80A-expressing cells, in which the ER is either fragmented or converted into long, unbranched tubules. ATL-1 K80A R217Q is both GTPase- and dimerization- defective. The bottom row shows three time points for calreticulin staining. Stationary pixels appear white, while those moving appear in colors. Scale bar = 10 µm. (C) As in (A), but with cells stably expressing mCherry-tagged cytoplasmic fragments of wild type ATL-1 (cytATL-1 WT), a mutant defective in GTP hydrolysis (cytATL-1 K80A) at low or high level, or a mutant defective in dimerization (cytATL-1 R217Q). CytATL-1 K80A R217Q contains both mutations. The bottom two rows show a close-up image of the peripheral network of the cells depicted in the first two rows. The bottom row shows three time points for calreticulin staining. Stationary pixels appear white, while those moving appear in colors. Scale bar = 10 µm.


