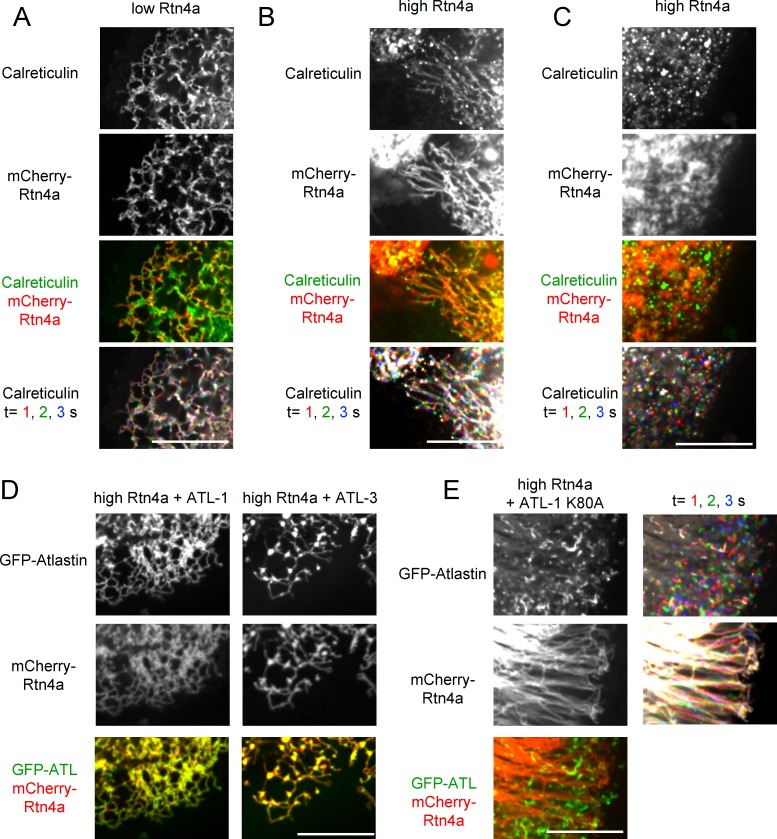
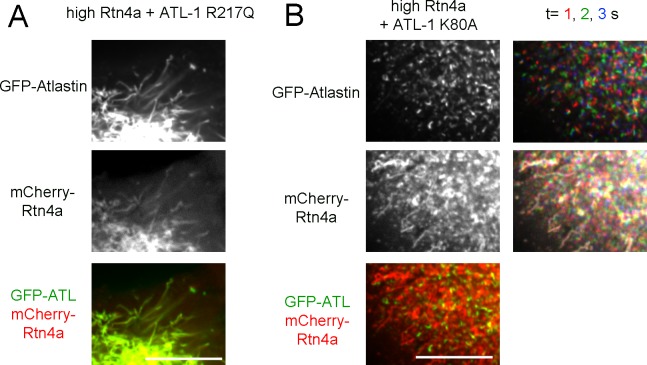
Figure 7. Interplay between ATL and the reticulons.
(A) Peripheral ER network in a U2OS cell expressing GFP-calreticulin under the endogenous promoter in wild type cells or in cells stably expressing mCherry-tagged Rtn4a. The bottom row shows three time points. Stationary pixels appear white, while those moving appear in colors. Scale bar = 10 µm. (B) As in (A), but with a higher expression level of mCherry-Rtn4a, resulting in unbranched tubules. (C) As in (B), but showing a cell with fragmented ER. (D) As in (B), but with cells that also stably express GFP-ATL-1 or GFP-ATL-3. (E) As in (B), but with cells that also express a GTPase defective ATL-1 mutant (GFP-ATL-1 K80A). The second column shows three time points for both the ATL and Rtn channels. Stationary pixels appear white, while those moving appear in colors. Scale bar = 10 µm.


