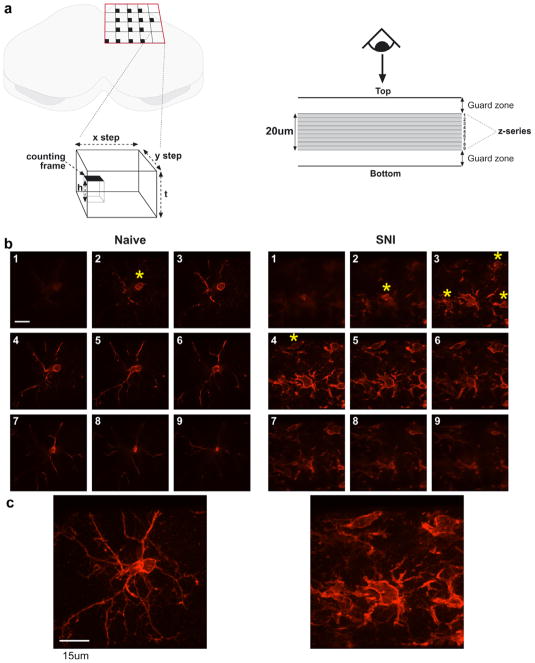
Fig. 1.
Schematic showing the sampling paradigm for the stereological analysis of microglia within the dorsal horn (a). Examples of images within optical dissectors for naïve and SNI rats are shown in (b). Extended focus images of each full z-series are shown in (C). Yellow asterisks indicate the emergence of a soma coming into focus to be counted. Scale bar = 15 μm. (For interpretation of the references to color in this figure legend, the reader is referred to the web version of this paper.)

