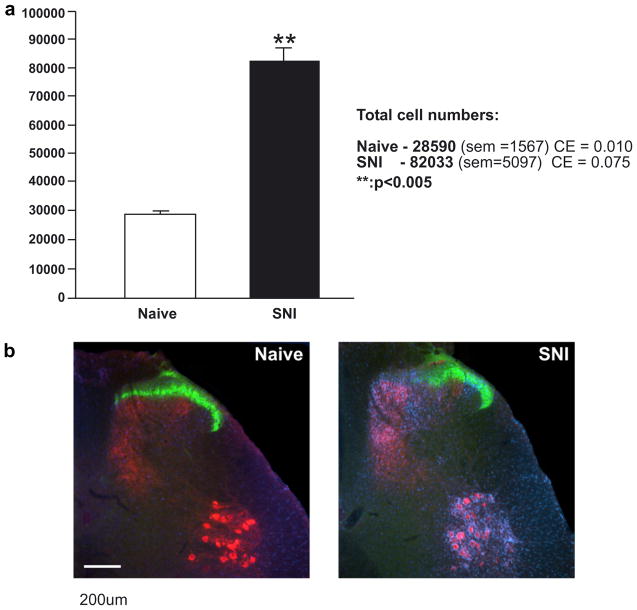
Fig. 2.
Quantitative analysis of microglia in the dorsal horn of naïve and SNI rats (a). Following SNI there is a marked significant increase in the ipsilateral dorsal horn (p < 0.005). (b) Examples of naïve and SNI sections showing the characteristic microglial response (blue). CTB-labelled central terminals are shown in red and IB4 labelling in green. Scale bar = 200 μm. (For interpretation of the references to color in this figure legend, the reader is referred to the web version of this paper.)

