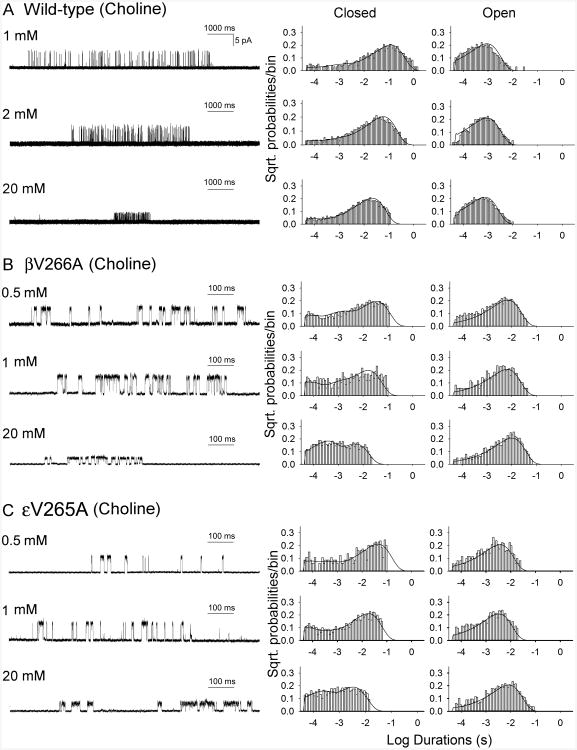
Fig. 4.
Kinetics of activation of wild-type AChR (A), βV266A-AChR (B), and εV265A-AChR (C). Left column, individual clusters of single-channel currents elicited by the indicated choline concentrations on HEK293 cells. Center and right columns show histograms of closed and open durations, respectively, with superimposed probability density functions for kinetic scheme of receptor activation for the entire range of choline concentrations. The rate constants are shown in Table 2. Mutations are indicated according to the legacy nomenclature.

