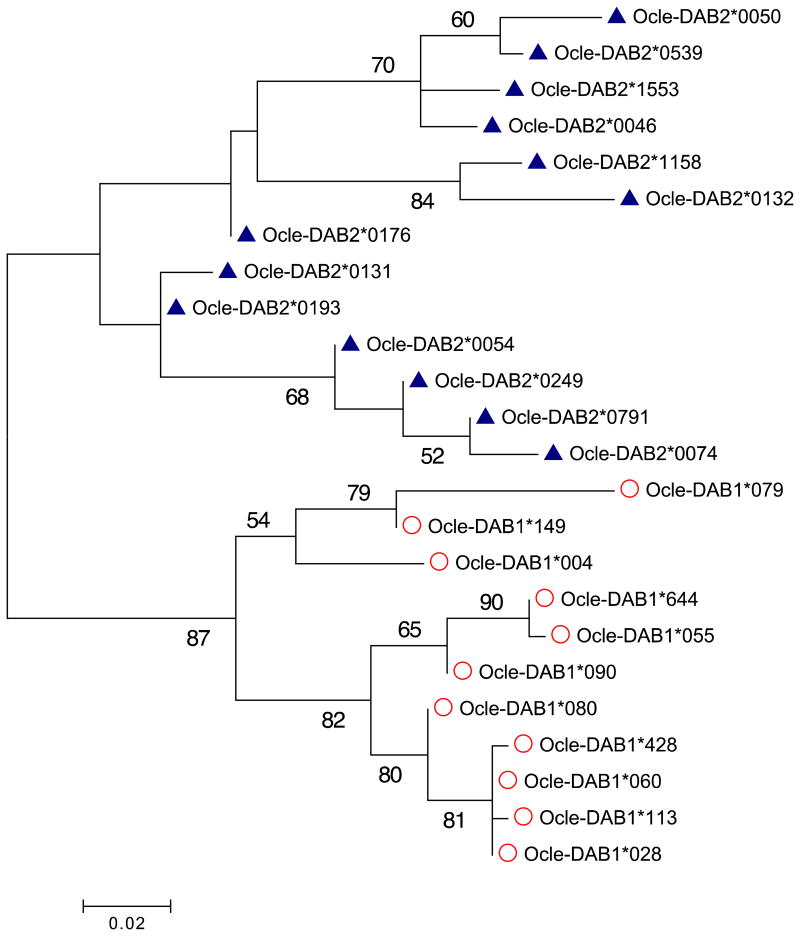
Figure 2.
Maximum likelihood tree of complete exon 2 sequences, with midpoint rooting to avoid assumptions about outgroup homology with duplicated genes. Bootstrap support values are shown where greater than 50%. Alleles are marked with open circles for Ocle-DAB1 and solid triangles for Ocle-DAB2. See Figure S2 for a phylogeny based on functional distance between alleles.

