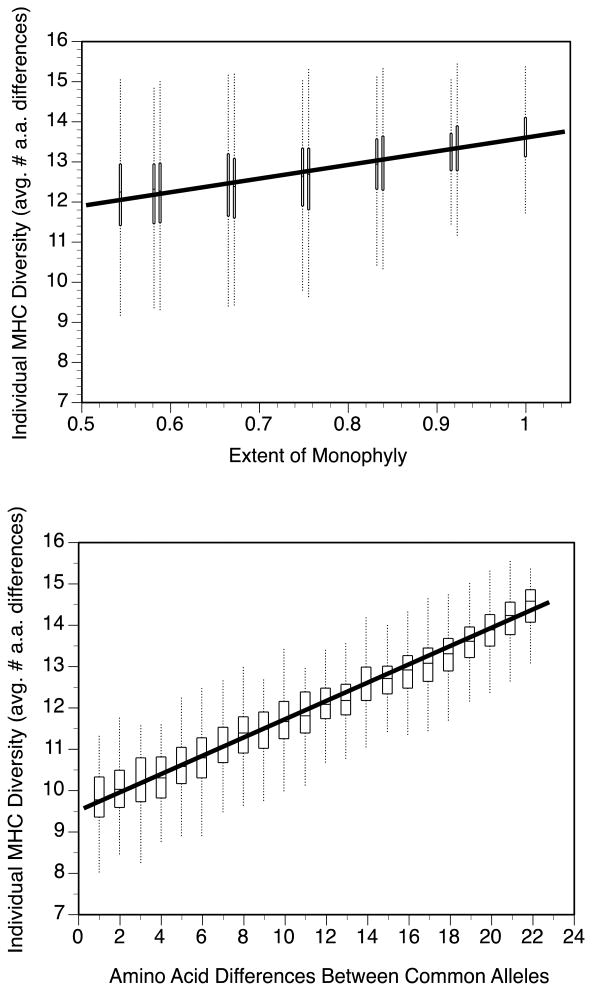
Figure 4.
MHC diversity within individuals, calculated in a model that permutes the locations of alleles within the distance matrix. MHC diversity is average number of amino acid differences in pairwise comparisons of an individual's 4 alleles. Box plots show distributions of model results at each level of the predictor variable.
(a) MHC diversity as a function of the extent of monophyly of the two loci.
(b) MHC diversity as a function of sequence divergence between the most common allele at each locus.
In a multiple regression testing both factors as predictors of individual MHC diversity, there was a steeper standardized slope for the effect of distance between common alleles (beta ± SE = 0.960 ± 0.011) than for the effect of the extent of monophyly (0.145 ± 0.011).

