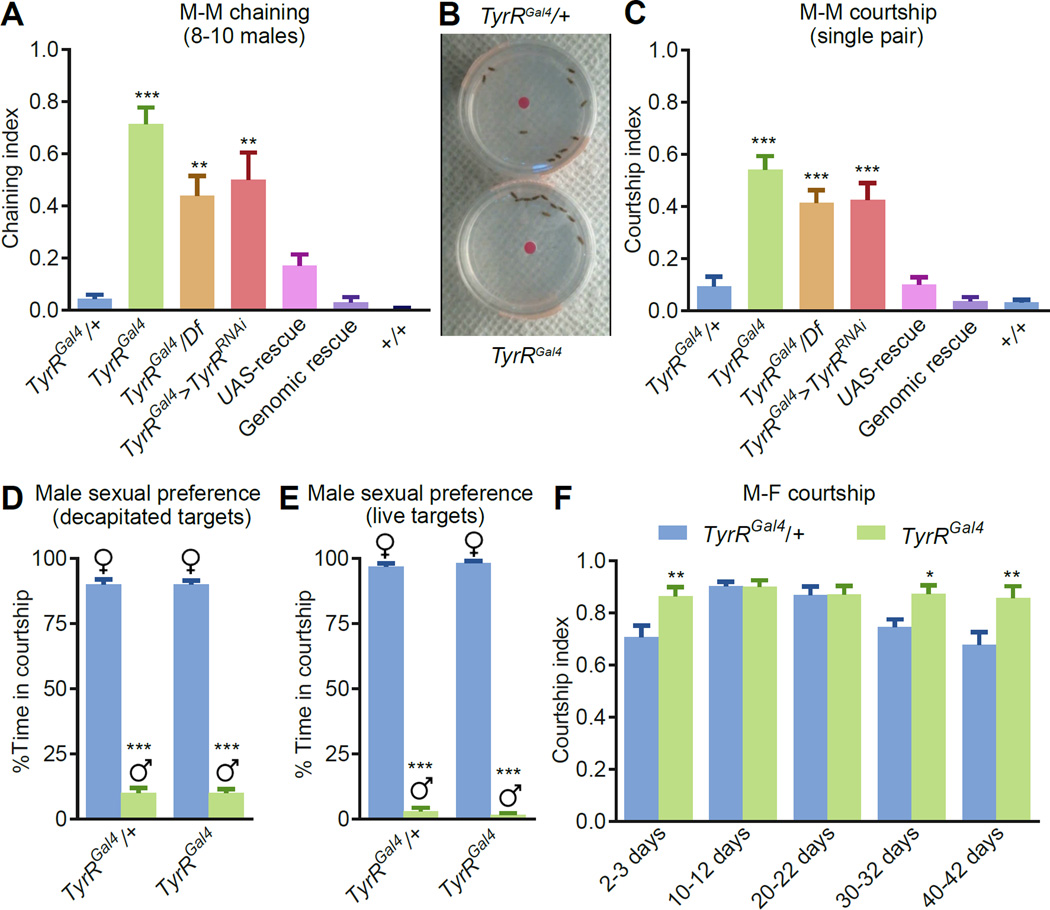
Figure 2. TyrRGal4 mutant showed enhanced courtship behavior.
(A) Chaining indices for groups of males of the indicated genotypes. The “wild type” +/+ flies used here and in other panels are w+ flies that have been outcrossed to w1118 for five generations. p<0.01; p<0.001 compared to control. n=7–10.
(B) A snapshot from Movie S1 showing male-male chaining exhibited by TyrRGal4 (bottom) but not the heterozygous control (top).
(C) Courtship indices using one target (w1118) male and one tester male of the indicated genotypes. p<0.001 compared to the TyrRGal4/+ control. n=24–29 trials/genotype.
(D) Testing sexual preference. Single TyrRGal4/+ and TyrRGal4 males were tested for courtship behavior towards a single decapitated female and a single decapitated male. p<0.001 compared to the other gender. n=24.
(E) Single TyrRGal4/+ and TyrRGal4 males were tested for courtship behavior towards a single w1118 female and a single fruM null (fruLexA/fru4–40) male. p<0.001 compared to the other gender. n=24.
(F) Courtship indices using different age groups of w1118 females and heterozygous or TyrRGal4 homozygous males. The ages of the target females are indicated. n=13–15 trials/genotype.
The error bars depict the means ±SEMs. All analyses of two samples employed Mann-Whitney tests. To analyze multiple samples we used the Kruskal-Wallis and Dunn’s post hoc test. **p<0.01. ***p<0.001.
See also Figure S1.

