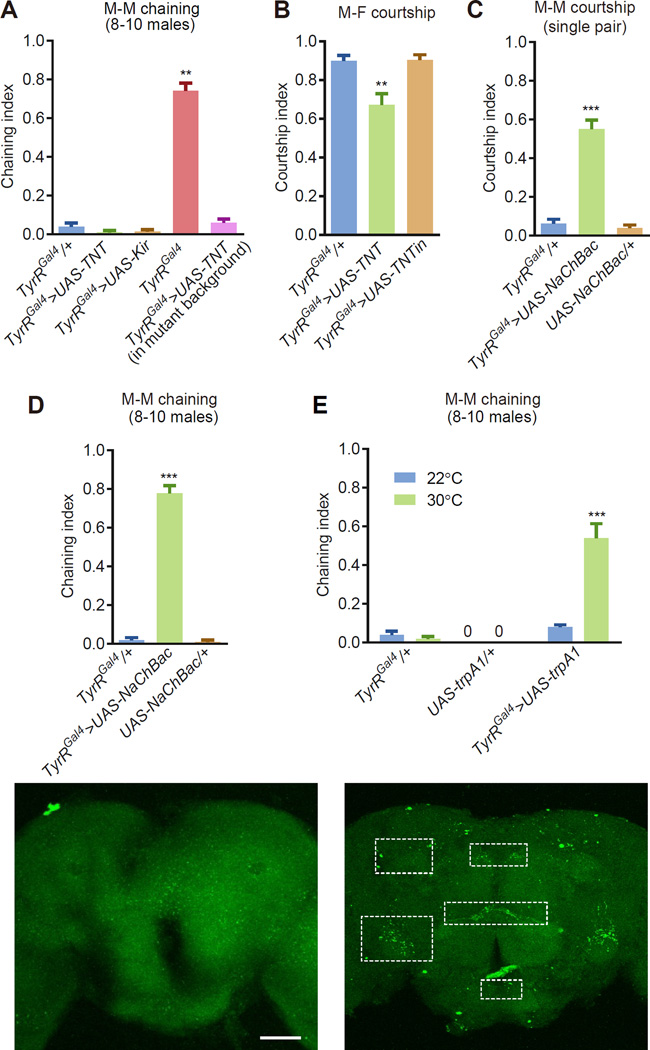
Figure 3. Activating or silencing TyrR neurons affected courtship behavior.
(A) Chaining indices using groups of 8–10 males. To silence the TyrR neurons, we expressed UAS-TNT or UAS-Kir2.1 under control of the TyrR-Gal4 (TyrRGal4/+). TyrRGal4>UAS-TNT flies contain two copies of the TyrRGal4 insertion, and are therefore mutants. Statistical significance was determined by comparing the data to the TyrRGal4/+ control. n=5–8.
(B) Single pair male-female courtship after silencing TyrR-expressing neurons by expressing UAS-TNT in the males. We used males of the indicated genotypes and control (w1118) virgin females. Changes were compared to the TyrRGal4/+ control. n=24 trials/genotype.
(C) Male-male courtship indices in males with hyperactivated TyrR-expressing neurons. We combined one male expressing UAS-NachBac in TyrR neurons (TyrRGal4/+) in combination with one control (w1118) male. Controls expressing just the Gal4 or UAS transgene are included. n=18–20 trials/genotype.
(D) Chaining indices exhibited by groups of males with TyrR neurons constitutively activated by UAS-NachBac. n=5–13
(E) Chaining among groups of males in which we thermally hyperactivated TyrR neurons with UAS-trpA1. n=5–7.
(F and G) Putative synaptic connections between TyrRGal4 and fruM neurons in the brain using the GRASP technique. All GRASP signals represent endogenous GFP fluorescence (no GFP antibodies were used). (F) Representative negative control showing the lack of GFP signal when using one rather than both GRASP components.
(F) GRASP-mediated GFP reconstitution observed in the SCL, AVLP, CRE, AL and PENP regions (dotted rectangles) due to TyrRGal4 neurons expressing CD4::spGFP1–10 and fruLexA neurons expressing CD4::spGFP11. SCL, superior clamp; AVLP, anterior ventrolateral protocerebrum; CRE, crepine; AL, antennal lobe; PENP, periesophageal neuropils. The scale bars represent 50 µm.
The error bars represent the means ±SEMs. We used the Kruskal-Wallis and Dunn’s post hoc test. **p<0.01. ***p<0.001.
See also Figure S2.

