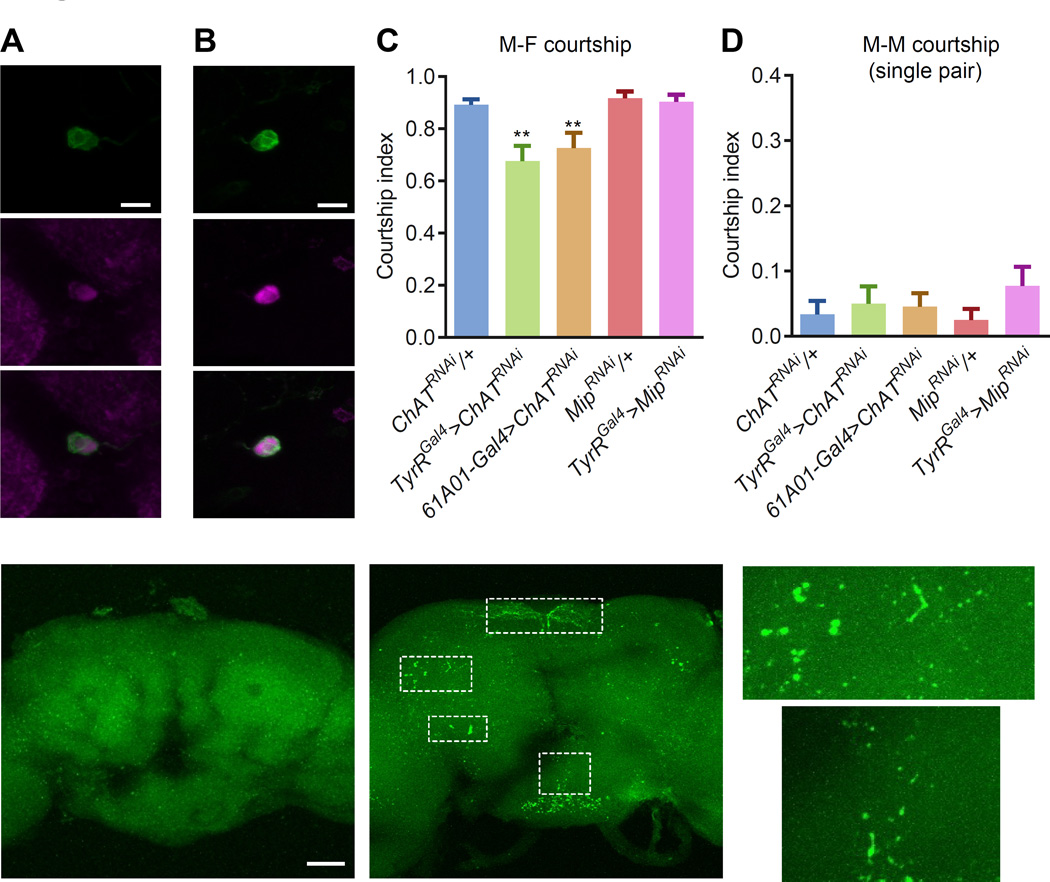
Figure 5. Functional and anatomical analyses of IPS neurons.
(A) Double immunostaining using anti-GFP (green; TyrRGal4>UAS-mCD8-GFP) and anti-choline acetyltransferase (ChAT, magenta) in IPS neurons.
(B) Double immunostaining using anti-GFP (green) and anti-MIP (magenta) in IPS neurons.
(C) Single-pair male-female courtship indices after RNAi knockdown of Mip or ChAT in male TyrR neurons. The females were w1118 virgins. n=23–25.
(D) Single-pair male-male courtship indices after RNAi knockdown of Mip or ChAT in male TyrR neurons. n=18–21
(E-H) Images of brains showing putative synaptic connections between IPS and FruM neurons using the GRASP technique. All GRASP signals represent endogenous GFP fluorescence (no GFP antibodies were used). (E) Representative image showing a lack of GPF signal in a brain expression only one of the two GRASP components. (F) GRASP-mediated GFP reconstitution in the SMP, SCL, AVLP and PENP regions (dotted rectangles). The 61A01-LexA neurons expressed CD4::spGFP11 and the fruNP21-Gal4 neurons expressed CD4::spGFP1–10. (G-H) Close-up images of the boxed regions (SCL and PENP) in F.
The scale bars represent 10 µm in A and B and 50 µm in E and F.
See also Figure S3.

