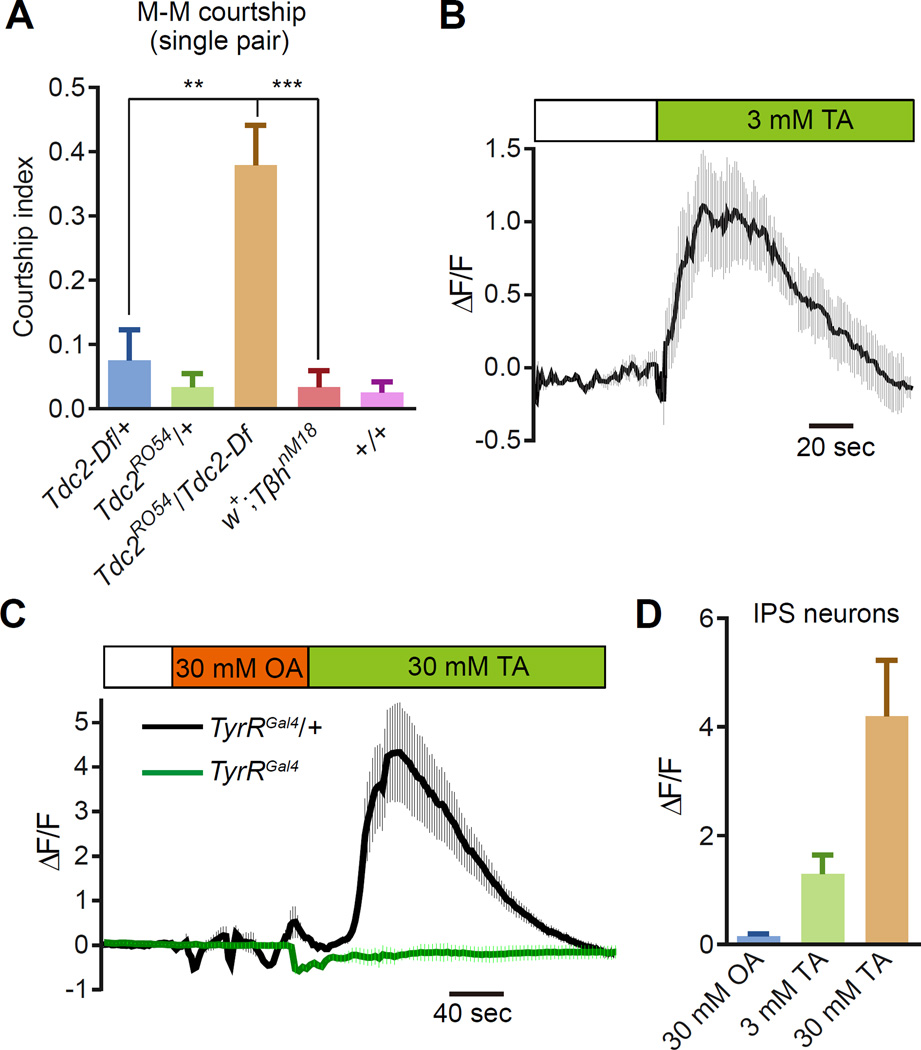
Figure 6. TyrR neurons respond to tyramine specifically.
(A) Male-male courtship indices using one target (w1118) male and one tester male of the indicated genotypes. n=12 trials/genotype
(B) Ca2+ imaging of TyrR neurons (TyrRGal4>UAS-GCaMP6f) in a brain subjected to 3 mM tyramine (TA). The ΔF/F represents the evoked fluorescence change from the baseline. The traces were averaged from 8 samples. The solid line represents the mean and the shaded areas indicate SEMs.
(C) Ca2+ response displayed by IPS neurons upon application of either 30 mM octopamine (OA) or 30 mM TA. Shown are the responses of the homozygous TyrR mutant (green trace) and the TyrRGal4 heterozygous control (black trace). (D) Ca2+ responses resulting from application of either 3 or 30 mM TA to IPS neurons. The 30 mM OA serves as a negative control. n=9 samples.
See also Figure S4.

