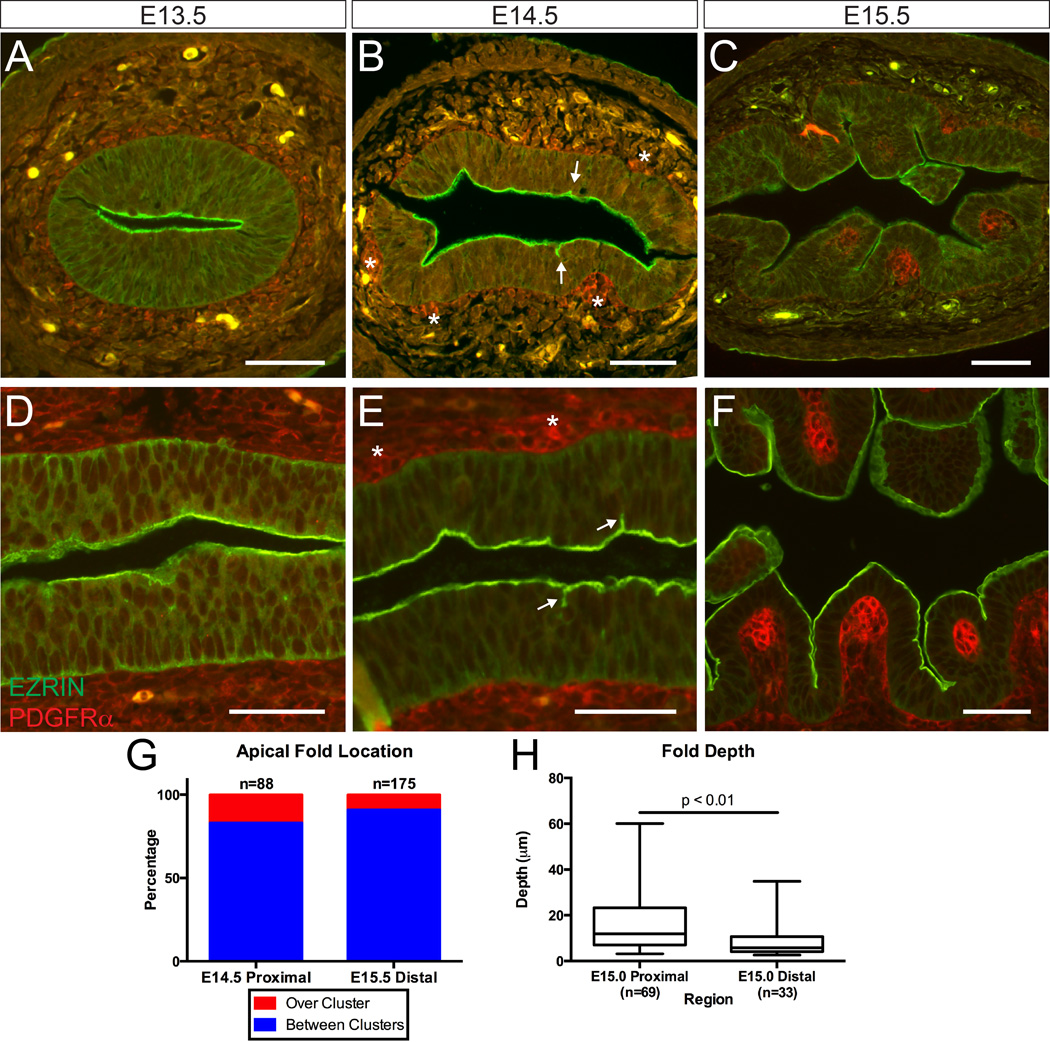
Figure 1. Temporal analysis of the intestinal apical surface during villus initiation.
(A–C) Cross-sections and (D–F) longitudinal sections of the murine small intestine at (A, D) E13.5, (B, E) E14.5, and (C, F) E15.5 stained with EZRIN (green) and PDGFRα (red). Initial deformations appear at E14.5 (B and E, arrows). Mesenchymal clusters are marked with asterisks. Folds deepen to clearly demarcate villi by E15.5. Scale bar = 50 µm. (G) Quantification of fold location relative to mesenchymal clusters at the morphogenic front of villus development at E14.5 and E15.5. (H) Box and whisker plots comparing fold depth in the E15.0 proximal and distal intestines showing the maximum, minimum, and median of the data sets (p = 0.0026, unpaired t-test).

