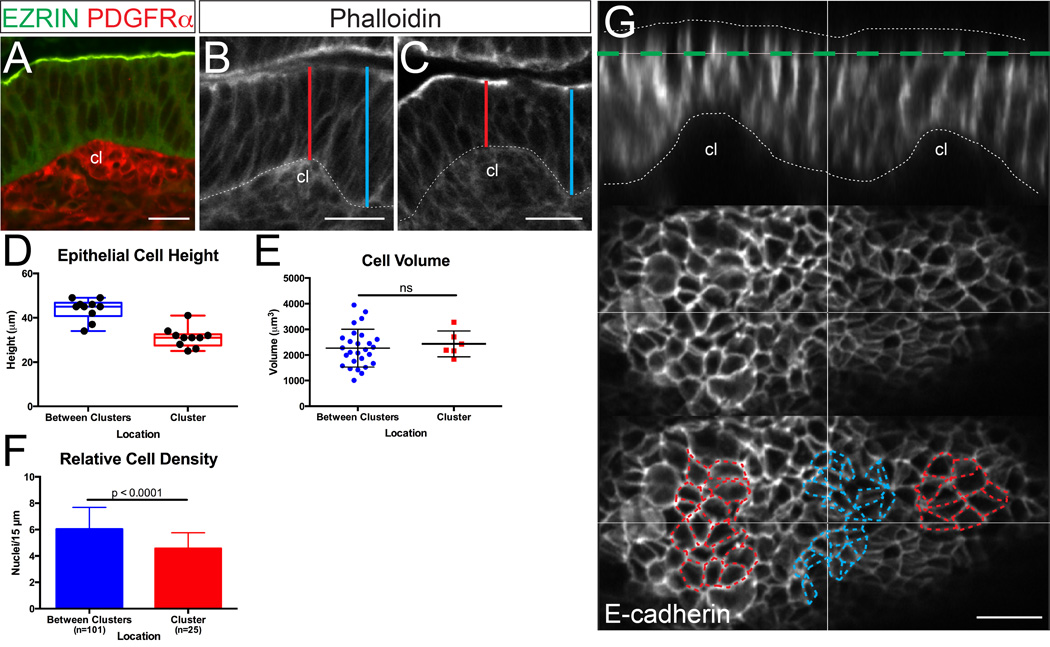
Figure 5. Epithelial cells above mesenchymal clusters are shorter and wider.
(A) Example of the basal epithelial deformation that is created by a small mesenchymal cluster (cl, labeled with PDGFRα, red), at a time when the apical surface above the cluster (labeled with EZRIN, green) remains flat. (B,C) Sections are stained with phalloidin (white). Cluster-induced basal deformations are not seen in the absence of mesenchymal clusters17 and can be easily discerned in phalloidin-stained sections. Lines show the points of measurement of epithelial cell height over (red) and adjacent to (blue) basal deformations caused by clusters (cl). Some sections that were used for measurement were co-stained with the cluster marker, PDGFRα. Scale bar = 20 µm. (D) Box and whisker plots comparing epithelial cell height over mesenchymal clusters and between clusters, showing the maximum, minimum, and median of the data sets. (E) Comparison of cell volume over and between clusters (p > 0.05, unpaired t test). Error bars represent standard deviation. (F) Quantification of epithelial nuclei per unit apical surface (“Relative Cell Density”) above and between clusters (p < 0.0001, unpaired t test). Error bars represent standard deviation. (G) Cross-section through the epithelium (E-cadherin, white, and outlined) just after cluster formation. Bottom panels are projections of the plane highlighted in green. Note that cells over clusters (outlined in red) appear expanded circumferentially relative to cells between clusters (outlined in blue). Scale bar = 15 µm.

