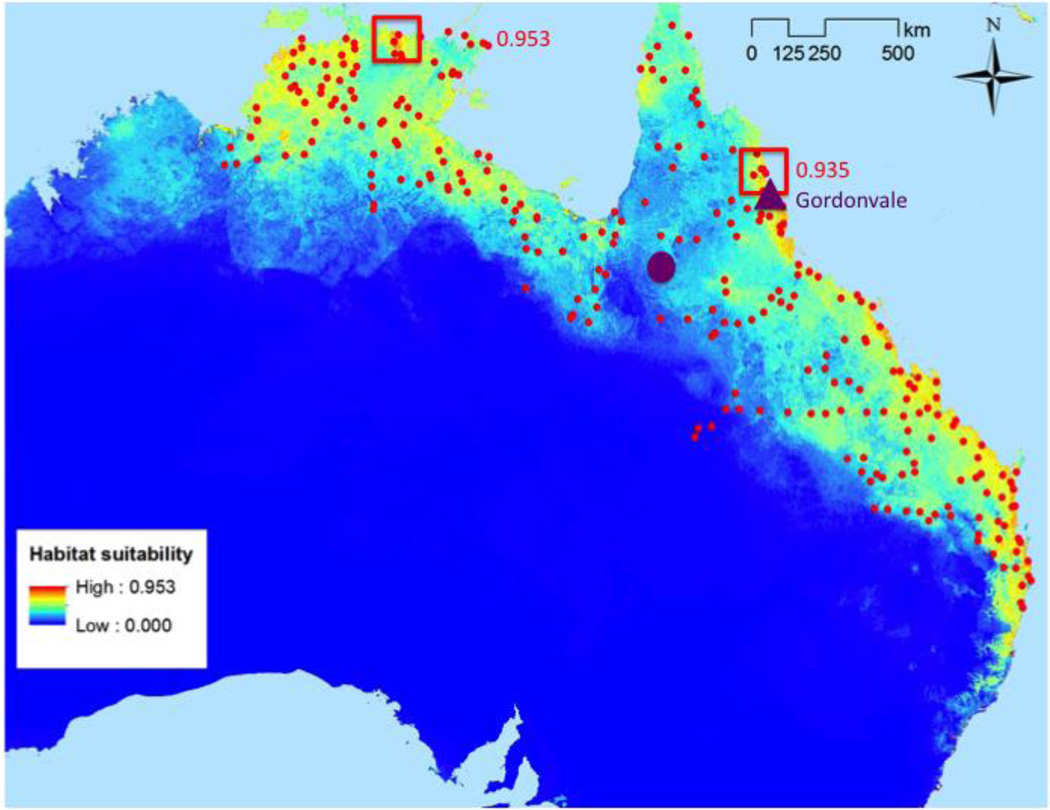
Figure 2.
Maxent model of habitat suitability (blue to red=low to high suitability); including 264 localities used to build (75%) and test (25%) the model (red circles); original introduction site in Gordonvale, QLD in 1935 (purple triangle); geographic center of the range (purple circle), and the highest habitat suitability values overall (0.953) and in the eastern portion of the range (0.935) (red boxes). Map shows median Maxent habitat suitability from 100 bootstrap replicates.

