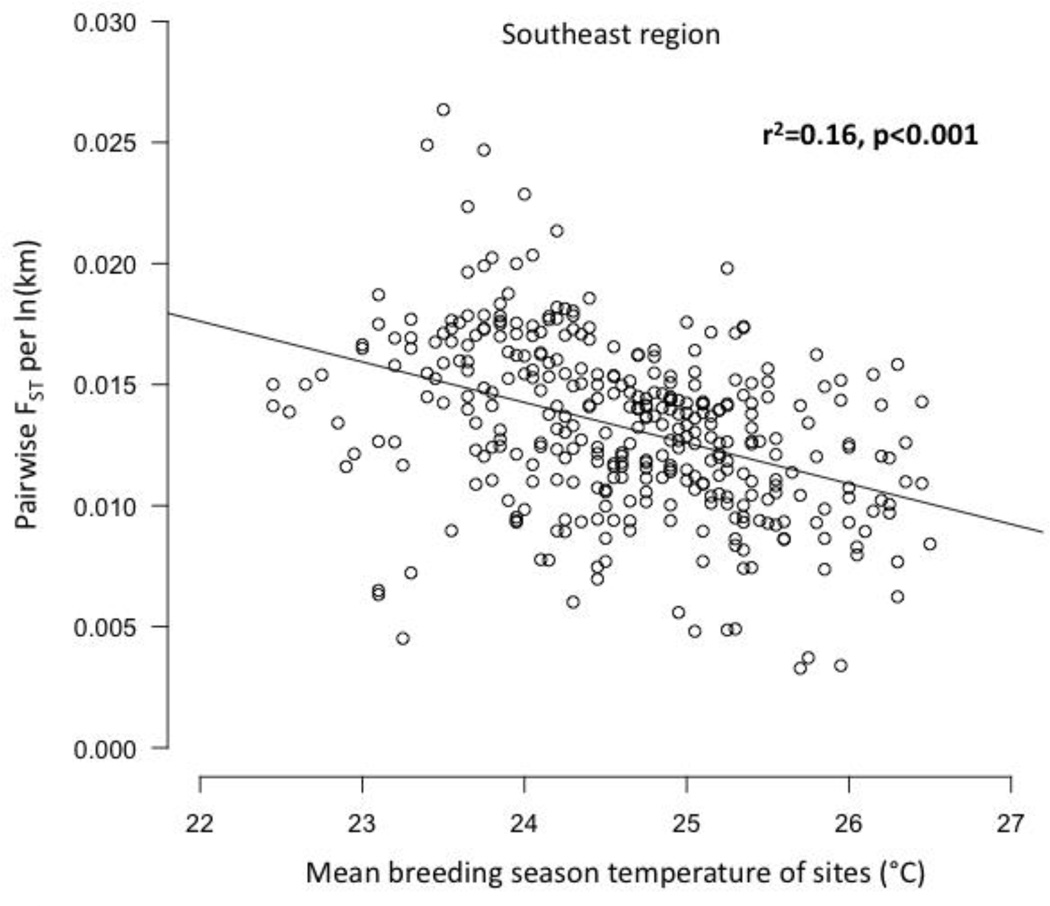
Figure 5.
Regression plot of genetic differentiation, normalized by distance between populations, represented by pairwise FST per ln(km), versus mean temperature of the warmest quarter (i.e., cane toad breeding season in the southeast) of each pair of sites. FST per ln(km) decreases significantly from colder to warmer pairs of sites in the southeastern region.

