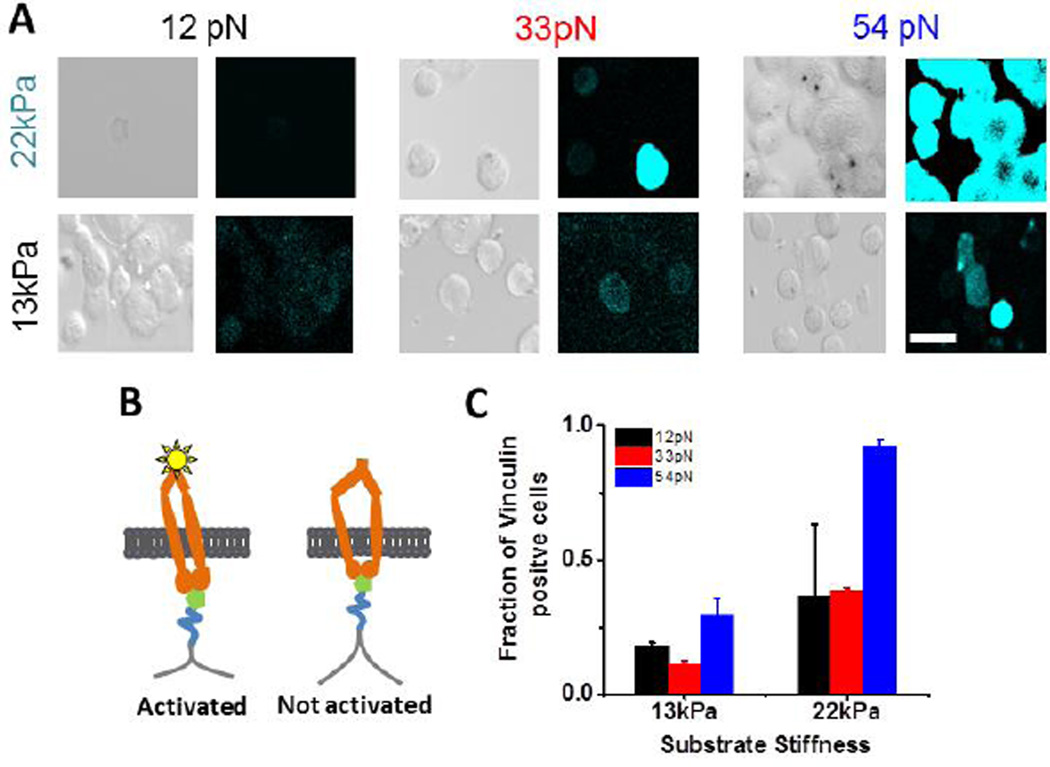
Figure 4.
(A) DIC and vinculin immunofluorescence (cyan) images at the basal plane of B16F1 cells on substrates of indicated stiffness and tension tolerance, imaged under identical conditions (cropped from images in Fig. S6A). Scale bar 50 µm. (B) Model of RGD binding, integrin activation, and vinculin binding (star). (C) Fraction of vinculin positive cells in the population of attached cells, under different conditions. The error bars represent S.E.M. (Nexp=2, n (cells)12pN,13kPa =30, n33pN,13kPa =36, n54pN,13kPa =36, n12pN,22kPa =8, n33pN,22kPa =36 n54pN,22kPa =45).

