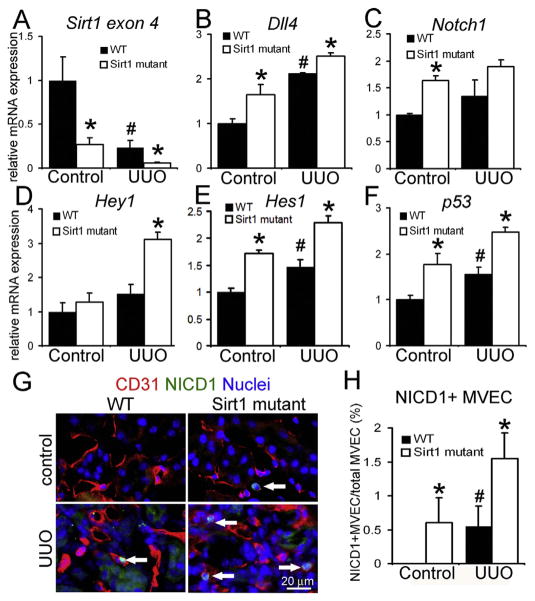
Fig. 2. Loss of functional SIRT1 enhances Notch1 signaling in capillary endothelial cells following UUO kidney injury.
qPCR of Sirt1 exon 4 (A), Dll4 (B), Notch1 (C), Hey1 (D), Hes1 (E) and p53 (F) transcripts in MVECs isolated from control and UUO kidneys of WT and Sirt1 mutant mice. WT: n = 4 mice, Sirt1 mutant: n = 6 mice. (G) Immu-nofluorescence images of CD31+ NICD1+ MVECs in control and UUO kidneys of WT and Sirt1 mutant mice. Arrows indicate double positive cells. (H) Quantification of NICD1+ MVECs. Note that no NICD1+ MVECs are detected in control WT kidneys. n = 4 mice/group. *P < 0.05 vs. corresponding WT group, #P < 0.05 vs. WT control group. Scale bar, 20 μm.

