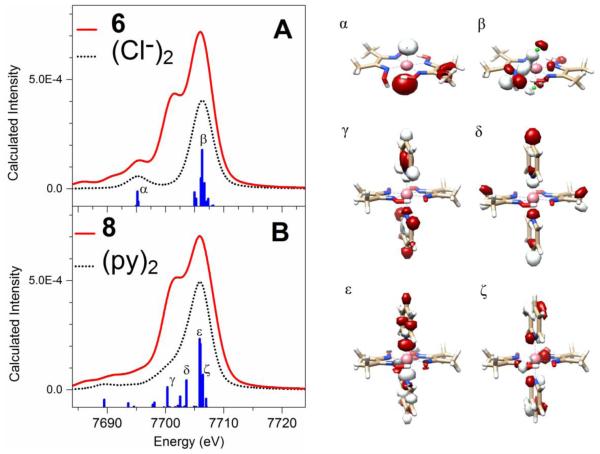
Figure 4.
Deconvolution of calculated X-ray emission spectra (solid red line) of the complexes [CoIII(dmgH)(dmgH2)(Cl)2] (6) (Panel A) and [CoIII(dmgH)2(py)2](NO3) (8) (Panel B) showing contributions from MOs with significant character from the two chloride or two pyridine moieties (black dotted line), respectively; a threshold of >20% Löwdin population was applied to the fragment analysis.

