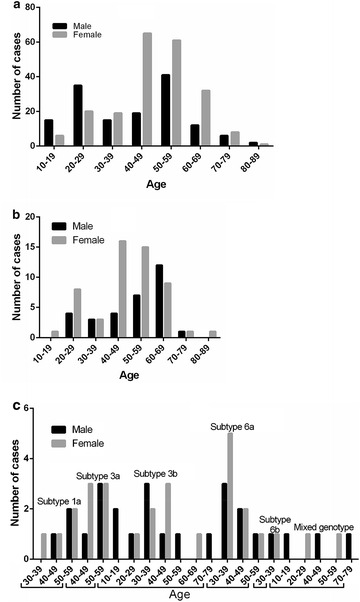
Fig. 8.

The distribution of HCV genotyping in different age and genders groups; a the results of HCV 1b genotyping in different age and genders groups; b the results of HCV 2a genotyping in different age and genders groups; c the results of HCV other genotyping in different age and genders groups
