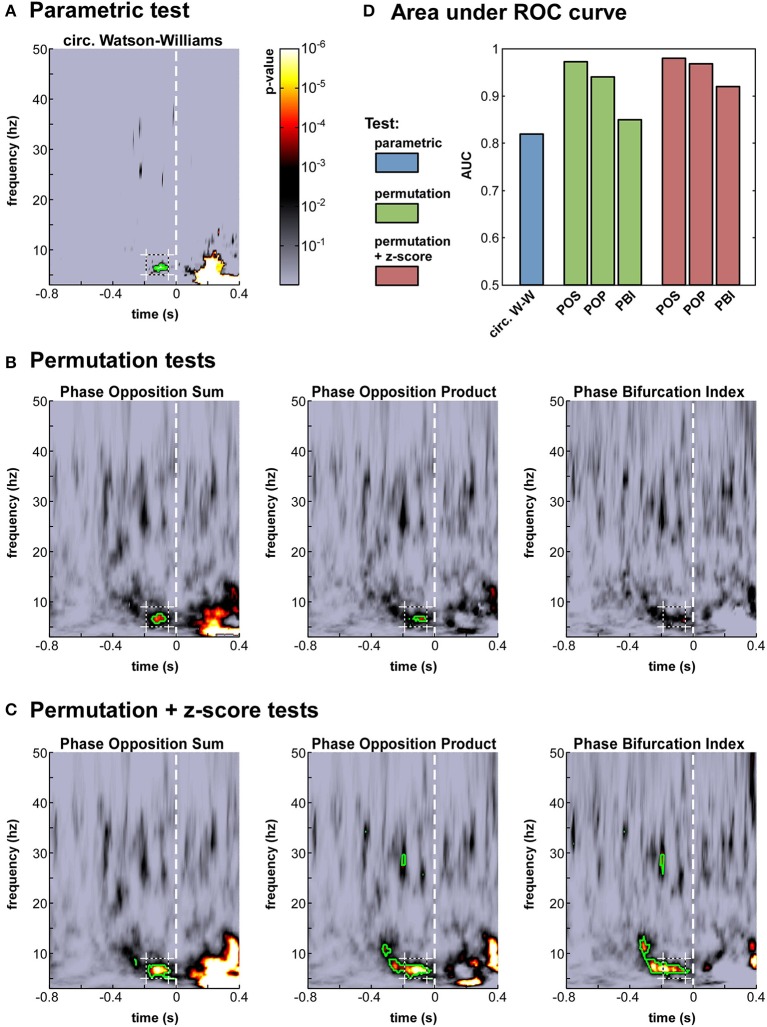
Figure 4.
Phase opposition in a real-life experimental dataset (Busch et al., 2009). (A-C) Time-frequency maps of p-values on electrode Fz [colorbar in panel (A), logarithmic scale] for the parametric test (A), the three permutation tests (B) and the hybrid tests combining permutation and z-score (C). The target time-frequency region (defined based on the results from the earlier study) is indicated by a dashed box. Time-frequency points with p-values below the threshold of FDR correction for multiple comparisons are outlined in green (D). Results of an AUC procedure contrasting the proportions of significant time-frequency points inside vs. outside the target time-frequency region. The bar colors correspond to those defined in Figure 2.

