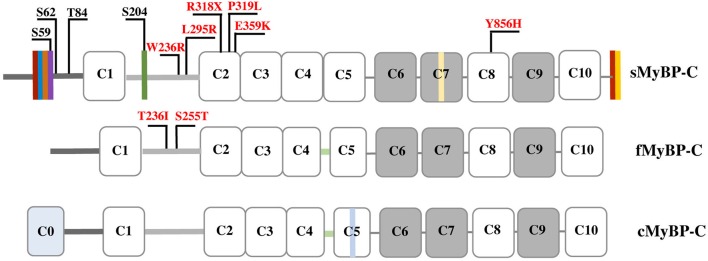
Figure 1.
Schematic representation of the three MyBP-C isoforms. Dark and light gray lines correspond to the Pro/Ala-rich region and the M-motif, respectively, while white and gray rectangles represent Ig and Fn-III domains, respectively. Vertical colored boxes in the Pro/Ala-rich region, the M-motif, Fn-III domain C7 and the extreme COOH-terminus of sMyBP-C indicate alternative spliced segments. fMyBP-C and cMyBP-C share a conserved linker region between C4 and C5, denoted in light green. cMyBP-C contains an additional Ig domain, C0, and an isoform-specific insertion in C5 shown in light blue. Phosphorylation sites in the Pro/Ala-rich region and the M-motif of sMyBP-C are indicated in black, and myopathic mutations in sMyBP-C and fMyBP-C in the M-motif and Ig domains C2 and C8 are shown in red.

