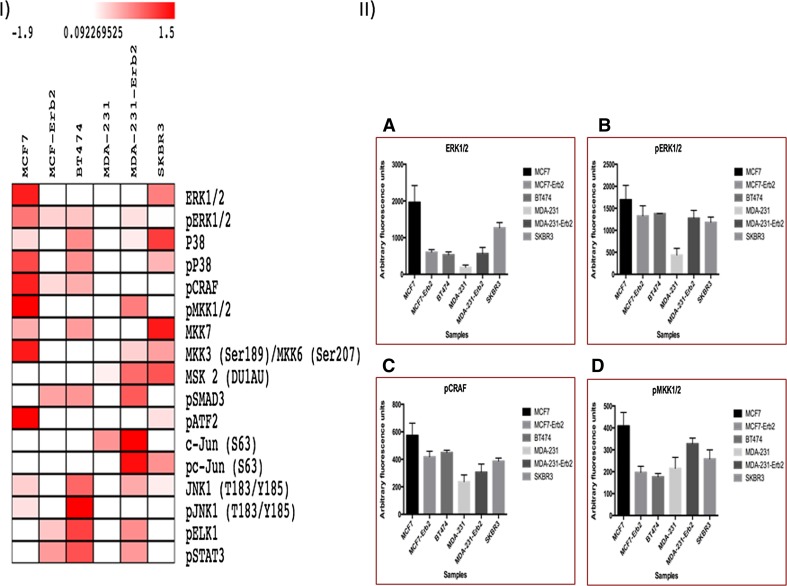
Fig. 3.
Heat-map showing different MAPK pathway intermediates studied in six different breast cancer cell lines. Rows represent the different signalling molecules studied. White and red denote markers that are present at lower and higher levels, respectively. II: Bar graphs representing measurement of selected target proteins from the heat-map data, including a ERK1/2, b pERK1/2, c pCRAF and d pMKK1/2. Data are shown as individual sample data (mean of four technical replicates per sample) of three different experiments. Signal represents arbitrary fluorescence units; AFU, after background subtraction and normalisation to β-actin. Significance values were derived using the Kruskal–Wallis test

