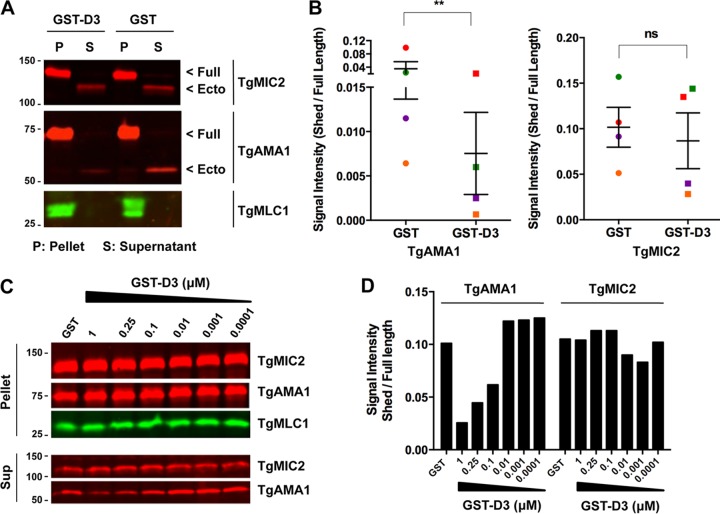
FIG 1 .
Treatment of parasites with GST-D3 peptide causes a dose-dependent reduction in the shedding of TgAMA1, but not TgMIC2. (A) Western blots from a microneme secretion assay using ARAMA1WT parasites treated with either 5 µM GST-D3 or GST and probed with anti-TgMIC2, anti-FLAG (TgAMA1), and anti-TgMLC1. Assay pellet (P) and assay supernatant (S) fractions are indicated. Arrowheads to the right of the blots indicate the positions of full-length (Full) TgAMA1 or TgMIC2 and the corresponding shed ectodomains (Ecto). The numbers to the left of the blots indicate molecular masses (in kilodaltons). The doublet in the TgMLC1 blot likely represents different phospho forms of TgMLC1 (57). (B) Signal intensity ratios of ectodomain in the supernatant to full-length protein in the pellet from four independent microneme secretion assays were plotted for TgAMA1 and TgMIC2. Paired signal intensity values from each of the biological replicates were plotted using the same color symbols. Values are means ± standard errors of the means (SEM) (error bars). A paired one-tailed t test revealed a significant decrease in the amount of TgAMA1 shed from parasites treated with GST-D3 (**, P = 0.0018) but no corresponding decrease in the shedding of TgMIC2 (P = 0.1379; not significant [ns]). (C) Representative Western blots of microneme secretion assay using ARAMA1WT parasites treated with 1 µM GST and six serial dilutions of GST-D3 (1 µM to 0.0001 µM). The pellet and supernatant (Sup) were each probed with anti-TgMIC2, anti-FLAG (TgAMA1), and anti-TgMLC1. GST-D3 caused a dose-dependent decrease in the amount of TgAMA1 (but not TgMIC2) ectodomain released into the assay supernatant. Numbers to the left of the blots indicate molecular masses (in kilodaltons). (D) Quantification of the Western blot in panel C. The signal intensity ratio of shed ectodomain in the supernatant to full-length protein in the pellet was plotted for both TgAMA1 and TgMIC2.

