
Figure 3.
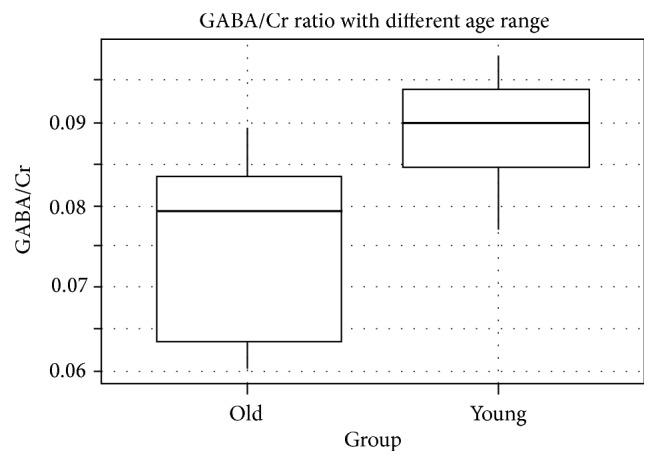
Box plot of GABA levels grouped by age. ns: not significant; t-test. Abbreviations: GABA, G-aminobutyric acid; Cr, Creatine.
Official websites use .gov
A
.gov website belongs to an official
government organization in the United States.
Secure .gov websites use HTTPS
A lock (
) or https:// means you've safely
connected to the .gov website. Share sensitive
information only on official, secure websites.
Box plot of GABA levels grouped by age. ns: not significant; t-test. Abbreviations: GABA, G-aminobutyric acid; Cr, Creatine.