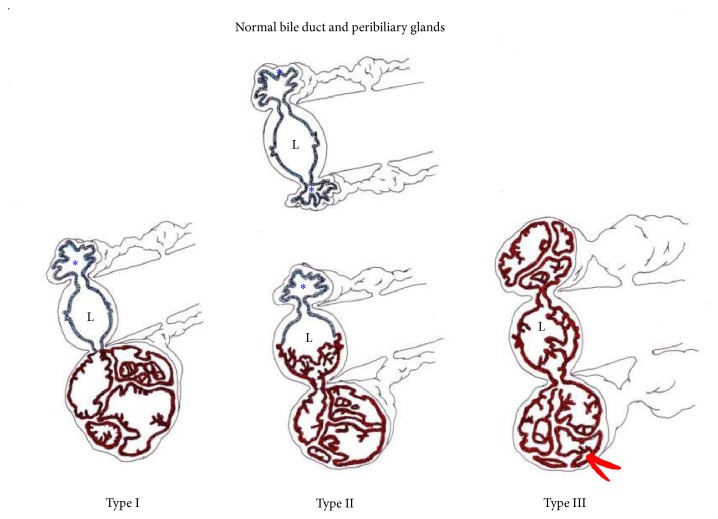
Figure 3.
A schematic diagram of cystic and papillary neoplasms involving the peribiliary glands (PGs). The blue epithelium indicates nonneoplastic glands, and brown epithelium indicates neoplastic glands. Red indicates an invasion of carcinoma arising in the neoplasm of the PGs. L: bile duct lumen; ∗ unaffected PGs. Type I shows neoplastic involvement confined to the PG, and type II shows main involvement of the PGs with partial secondary involvement of the adjacent bile duct. Type III reflects extensive involvement of the PGs with simultaneous involvement of the bile ducts, which may appear grossly as peribiliary cysts in the perihilar regions.

