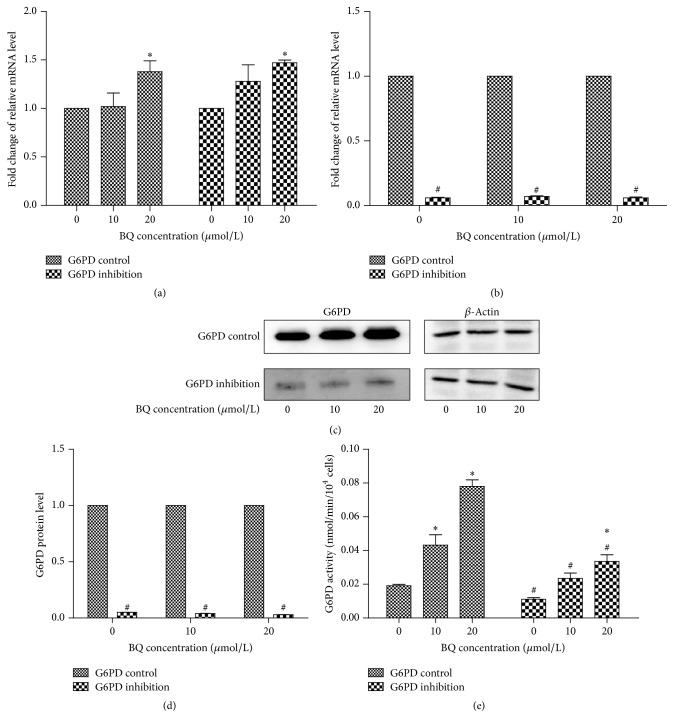
Figure 2.
mRNA, protein expression levels, and enzyme activity of G6PD in G6PD inhibition cells and control cells exposed to BQ. (a) Fold change of relative mRNA level by 10 and 20 μmol/L BQ treatment compared with 0 μmol/L BQ in G6PD control and inhibition cells. (b) Fold change in relative mRNA in G6PD inhibition cells compared with that in control cells at each BQ concentration. (c) Protein level of G6PD as determined by Western blot analysis. (d) Fold change in protein level in G6PD inhibition cells compared with that in control cells at each BQ concentration. (e) G6PD activity in G6PD inhibition cells and control cells at each BQ concentration. ∗ P < 0.05 compared with 0 μmol/L group; # P < 0.05 compared with G6PD control.

