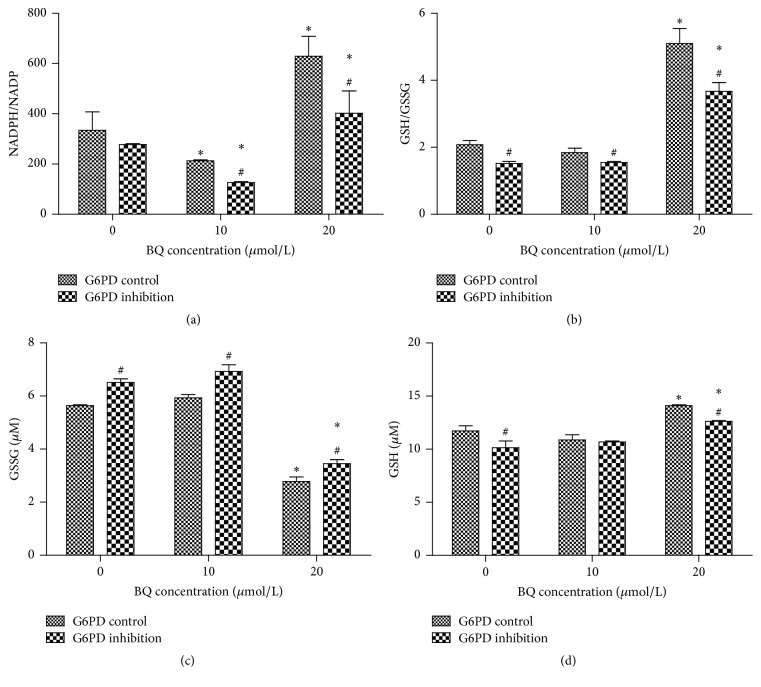
Figure 3.
NADPH/NADP and GSH/GSSG ratio in G6PD control and G6PD inhibition. (a) Ratio of NADPH/NADP in G6PD inhibition cells and control cells exposed to BQ. (b) Ratio of GSH/GSSG in G6PD inhibition cells and control cells exposed to BQ. (c) GSSG in G6PD inhibition cells and control cells exposed to BQ. (d) GSH in G6PD inhibition cells and control cells exposed to BQ. ∗ P < 0.05 compared with 0 μmol/L group; # P < 0.05 compared with G6PD control.

