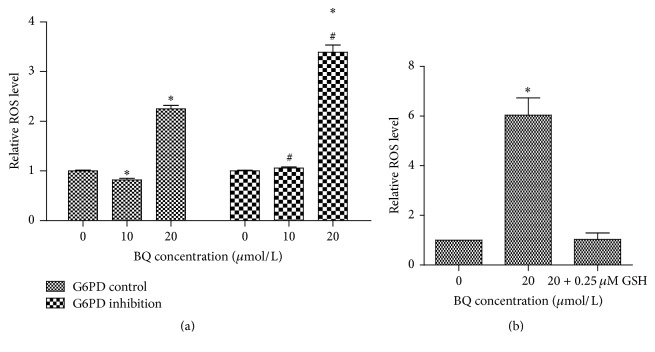
Figure 4.
Relative ROS level in G6PD control and G6PD inhibition cells. (a) Relative ROS level in G6PD control and G6PD inhibition cells exposed to 10 and 20 μmol/L BQ. (b) Relative ROS level in G6PD inhibition cells exposed to 20 μmol/L BQ and treated with 0.25 μmol/L GSH. ∗ P < 0.05 compared with 0 μmol/L group; # P < 0.05 compared with G6PD control.

