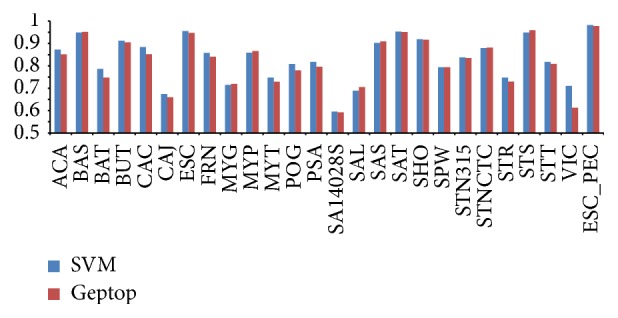
Figure 4.

Comparison AUC scores of interspecies prediction for 25 bacteria between SVM and Geptop. The last AUC score belongs to ESC whose data are obtained from PEC database. The vertical axis, in the range from 0.5 to 1, represents AUC scores. More than 65% of the results exceed the AUC score of 0.80, and 8 organisms' results of prediction yielded AUC scores more than 0.90. For 26 genomes including ESC_PEC, 18 of all are better than Geptop.
