Figure 5.

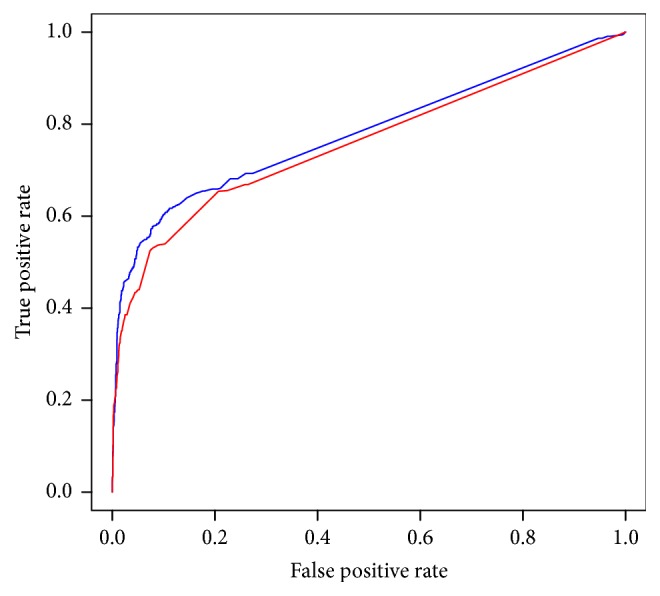
Comparison the ROC curve of Geptop and SVM for SYE. The blue curve represents the results obtained through SVM, and the area under it is 0.7855. The red curve represents the results obtained through Geptop, and the area under it is 0.7578.

Comparison the ROC curve of Geptop and SVM for SYE. The blue curve represents the results obtained through SVM, and the area under it is 0.7855. The red curve represents the results obtained through Geptop, and the area under it is 0.7578.