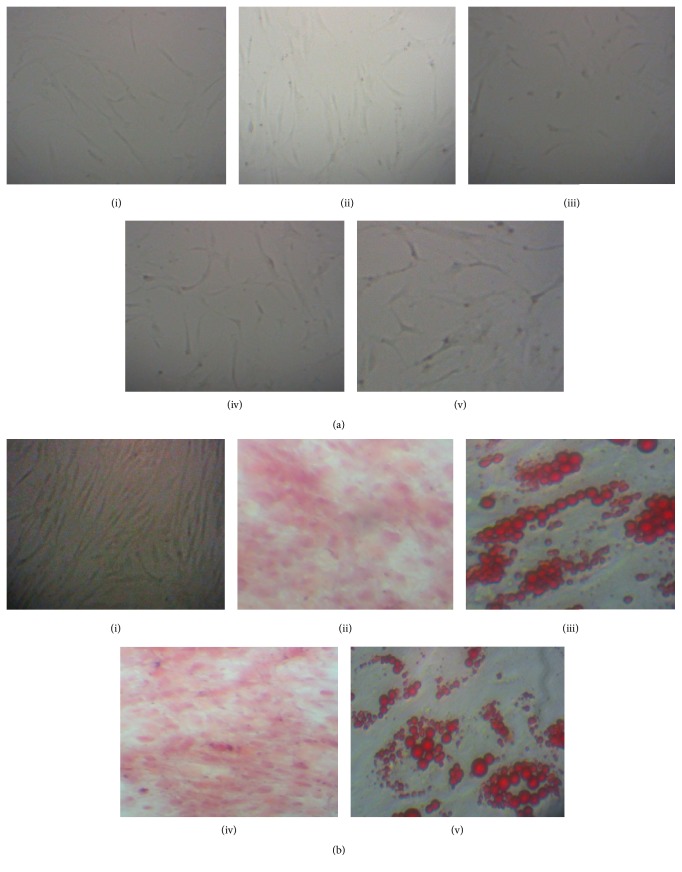
Figure 1.
Morphology and differentiation ability of MSCs isolated from controls and MDS patients. (a) Morphology of control and MDS-MSCs. P3 cells of (i) control, (ii) RCUD, (iii) RCMD, (iv) RAEB, and (v) MDS del(5q) at day 4 in culture (20x). (b) (i) Undifferentiated P3 MSCs. (ii) and (iv) are alizarin red stained osteoblasts of control and a MDS patient (14-080) (4x). (iii) and (v) are differentiated control MSCs and MDS-MSCs towards adipogenic cells (40x) as stained with Oil Red O.

