Figure 1.

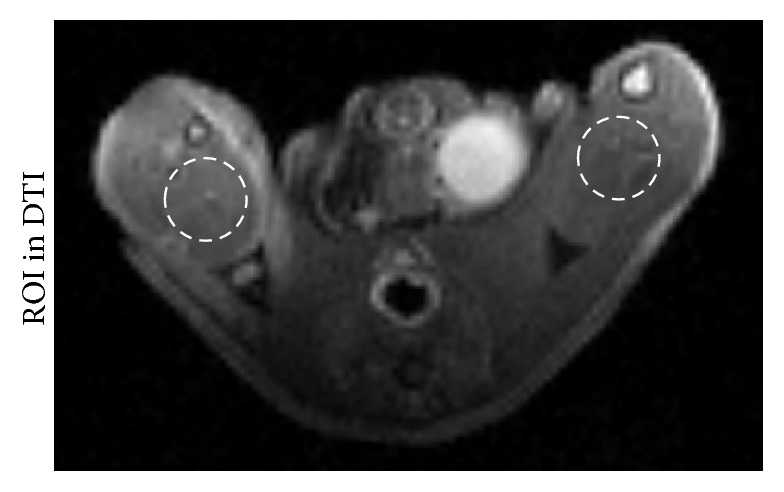
The example of regions of interest (ROI) for FA, ADC, λ1, λ2, and λ3 value of the gastrocnemius. ROI was drawn manually at the ischemic gastrocnemius muscle in DTI maps to measure the FA, ADC, λ1, λ2, and λ3 maps, respectively.

The example of regions of interest (ROI) for FA, ADC, λ1, λ2, and λ3 value of the gastrocnemius. ROI was drawn manually at the ischemic gastrocnemius muscle in DTI maps to measure the FA, ADC, λ1, λ2, and λ3 maps, respectively.