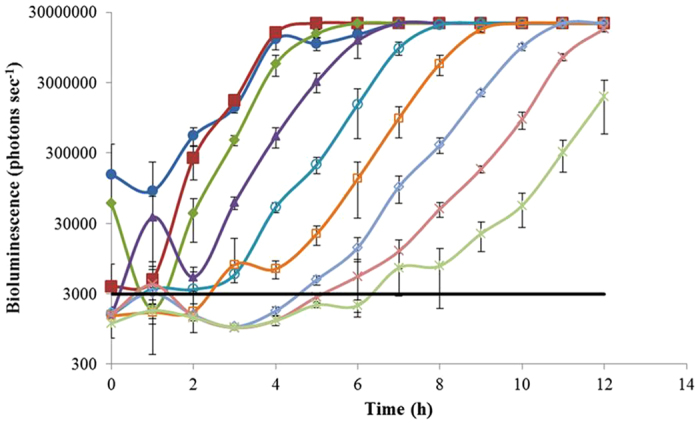
Figure 2. Profile of phage ΦV10nluc induced bioluminescence from E. coli O157:H7 grown in LB broth.

Wild type E. coli O157:H7 C7927 was inoculated at 5.40 × 10⁸ ( ), 5.40 × 10⁷ (
 ), 5.40 × 10⁶ (
 ), 5.40 × 10⁵ (
 ), 5.40 × 10⁴ (
 ), 5.40 × 10³ (
 ), 5.40 × 10² (
 ), 5.40 × 101 (
 ), 5.40 × 100 (
 ) CFU per assay (in a total of 40 ml), and the threshold (—) was set at double the background value. The phage added per assay was 1.76 × 10² pfu ml−1. At 1 hour intervals, individual light readings were recorded for triplicate samples. The cutoff of the bioluminescence reading was set up at 2.1 × 10⁷ photons per second which is the upper detection limit of the Sirius luminometer used in this study.
