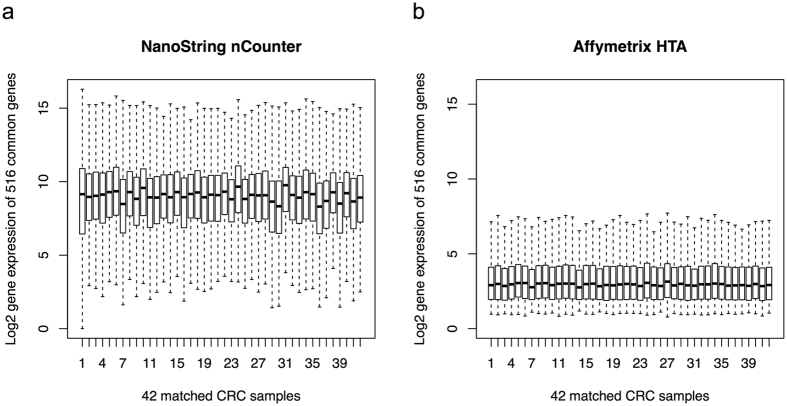
Figure 1. The signal intensity distributions of the 42 pairs of matched CRC samples measured by both nCounter platform and HTA platform.
The distributions of signal intensities of 42 pairs of matched CRC samples (30 technical replicates and 12 biological replicates) measured by nCounter platform (a) and HTA platform (b).

