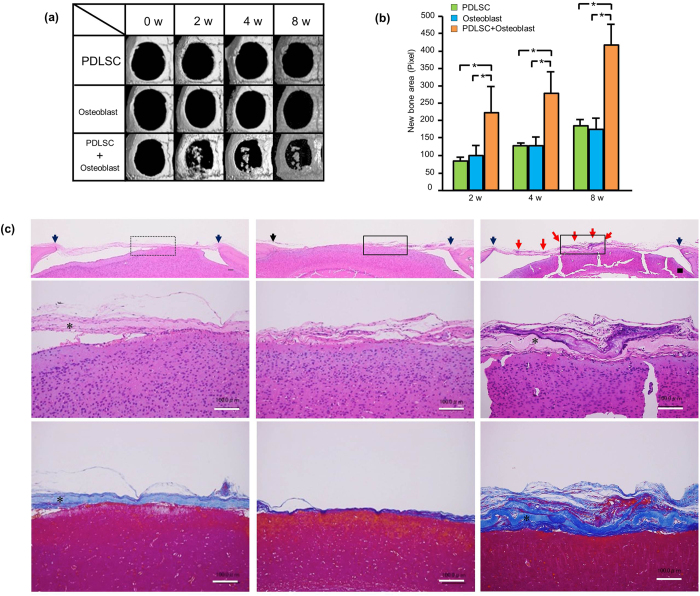
Figure 6. Bone regeneration by cell-transferred amnion.
(a) Representative micro CT images of bone defects after the transplantation of cell-transferred amnion. Bone defects were treated with cell-transferred amnion (PDLSC, HCO or PDLSC + HCO) and CT images were taken periodically. In the single cell transplantation (PDLSC or HCO), bone healing was limited, while new bone-like tissue formation was observed in bone defects transplanted with double-layered cell-transferred amnion (PDLSC + HCO). (b) Quantification of new bone formation area on micro CT images. We constructed the three-dimensional image from scan data and the area of newly formed bone-like tissue was quantified using image analysis software on the images. Bone defects with PDLSC + HCO showed more bone-like tissue formation than with PDLSC or HCO alone. (*P < 0.05, Tukey-test) (c) Histological view of bone defects 8 weeks after cell transplantation. Frontal sections of bone defects from PDLSC (left), HCO (middle) and PDLSC + HCO (right) are shown. Pictures were taken after hematoxylin and eosin (upper and middle) or azan staining (bottom) at lower (upper) and higher (middle and bottom) magnification. Box frames in upper pictures indicate maginified field. Clusters of mineralized tissue were prominent in PDLSC + HCO group, compared with PDLSC or HCO group. Red arrow: mineralized tissue Black arrow heads: margine of bone defect. *Amniotic membrane. Bar = 100 μm.

