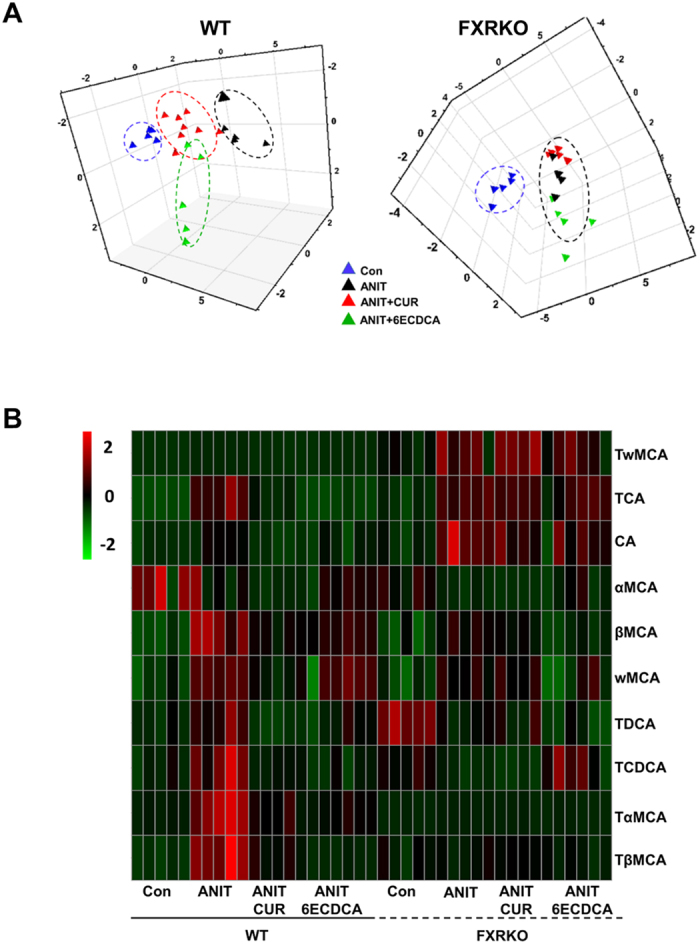
Figure 4. The effect of curcumin on ANIT-induced cholestasis through FXR-regulated bile acids profiles.

Ten individual bile acids were quantified by LC-MS in both WT and FXRKO mouse livers, which were visualized in score plot of principal component analysis (PCA) (A) and heatmap (B). The colors on the heatmap correspond to the contents of bile acids Red represents the increase, while green represents the decrease. Hierarchical clustering separates X axis of heatmap represents different groups within 5 samples, while Y axis stands for bile acid levels.
