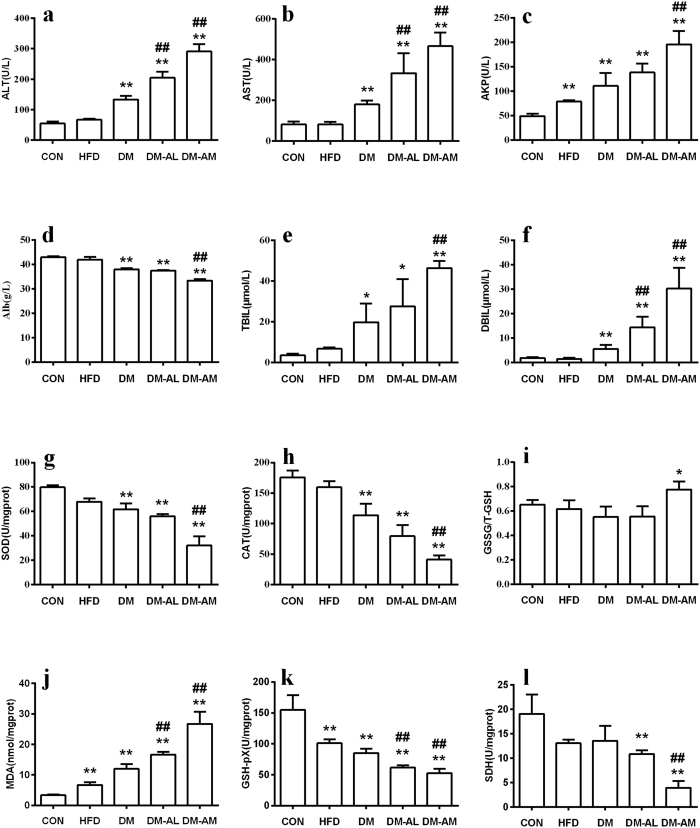
Figure 1.
The levels of ALT (a), AST (b), AKP (c), Alb (d), TBIL (e), DBIL (f), SOD (g), CAT (h), GSSG/T-GSH (i), MDA (j), GSH-pX (k) and SDH (l) in normal rats (CON), rats fed with high-fat diet (HFD), diabetic rats (DM), DM rats treated with 10 mg/kg of atorvastatin (DM-AL) and 20 mg/kg of atorvastatin (DM-AM) for 10 days. Data are represented as means ± SD (n = 5) *p < 0.05, **p < 0.01 vs. CON, #p < 0.05, ##p < 0.01 vs. DM.

