
Figure 3. Mitochondria and ganglia morphometrics of enteric neurons from patients and controls.
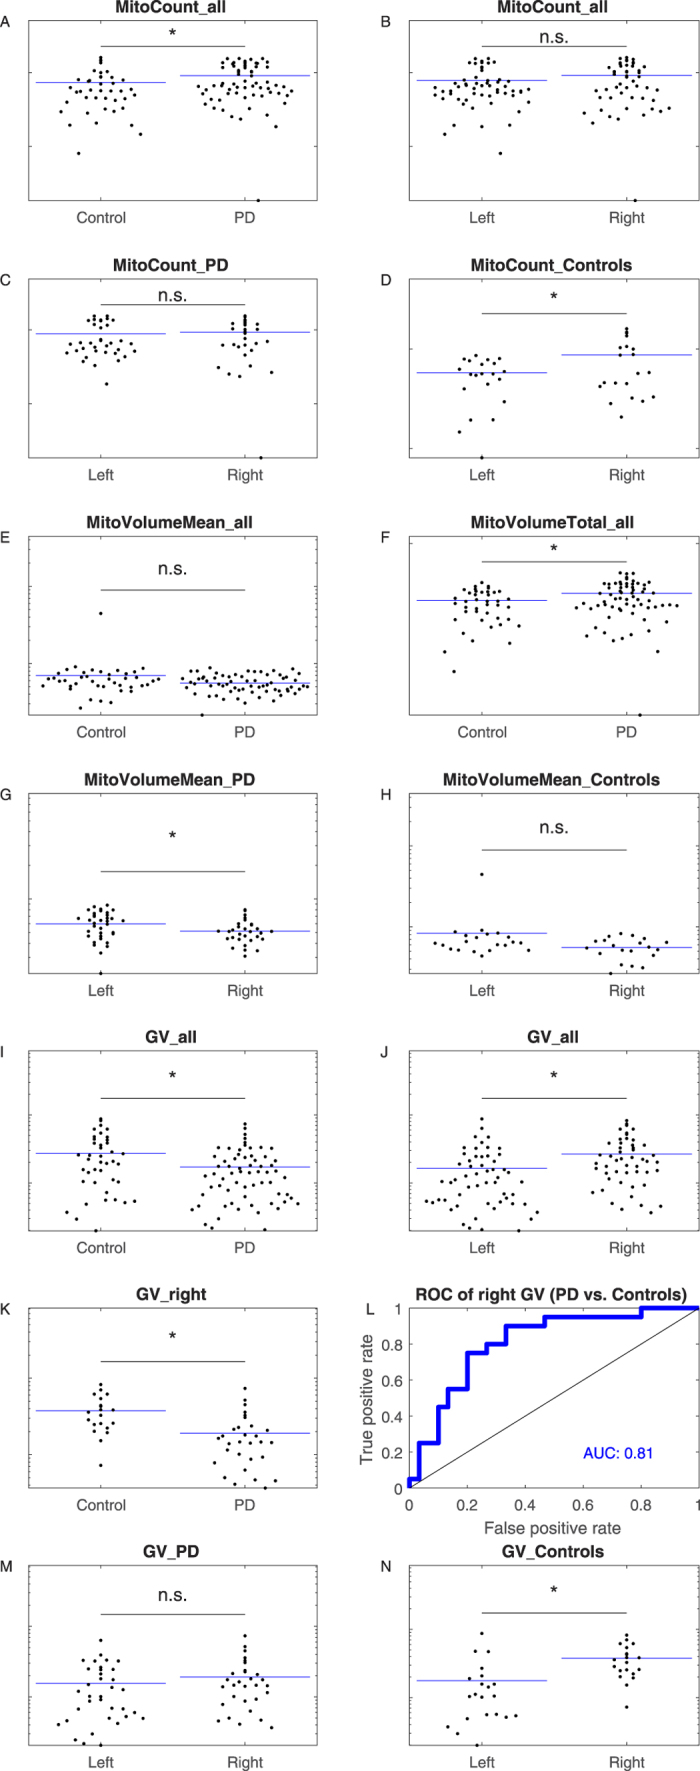
(A) Mitochondria count per volume of patients and controls (p = 0.043). (B) Mitochondria count per volume between left and right colon location independently of disease status (p = 0.11). (C) Mitochondria count per volume compared between left and right colon location from patients only (p = 0.61). (D) Mitochondria count per volume compared between left and right colon location from controls only (p = 0.022). (E) Mean mitochondria volume of patients and controls (p = 0.197). (F) Normalized mitochondrial mass of patients and controls (p = 0.017). (G) Mean mitochondria volume comparison between left and right colon location from patients only (p = 0.028). (H) Mean mitochondria volume comparison between left and right colon location from controls only (p = 0.076). (I) Ganglia volume of patients and controls (p = 0.005). (J) Ganglia volume comparison between left and right colon location independently of disease status (p = 0.004). (K) Ganglia volumes from the right colon of patients and controls (p = 0.0006). (L) ROC analysis. The corresponding p-value 2.3e-4 indicates the random chance that the AUC is not different from 0.5 (null hypothesis: AUC = 0.5). (M) Ganglion volumes of patients compared between left and right colon (p = 0.33). (N) Ganglion volumes of controls compared between left and right colon (p = 0.002). All features are plotted on log scales (A–K,M,N). AUC = area under the curve; PD = Parkinson’s disease; ROC = receiver operating curve.