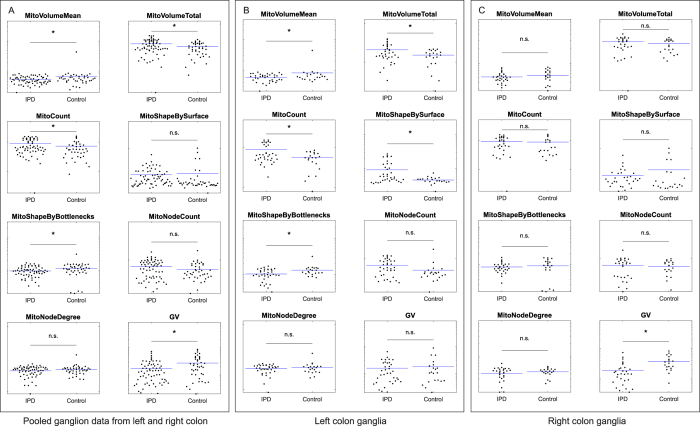
Figure 5. Ganglion and mitochondrial morphometric features.
Comparision of pooled ganglion data from left and right colon between patients and controls (A). Comparison of left colon ganglia between patients and controls (B). Comparison of right colon ganglia between patients and controls (C). All features are plotted on log scale axes and described in Fig. 2.

